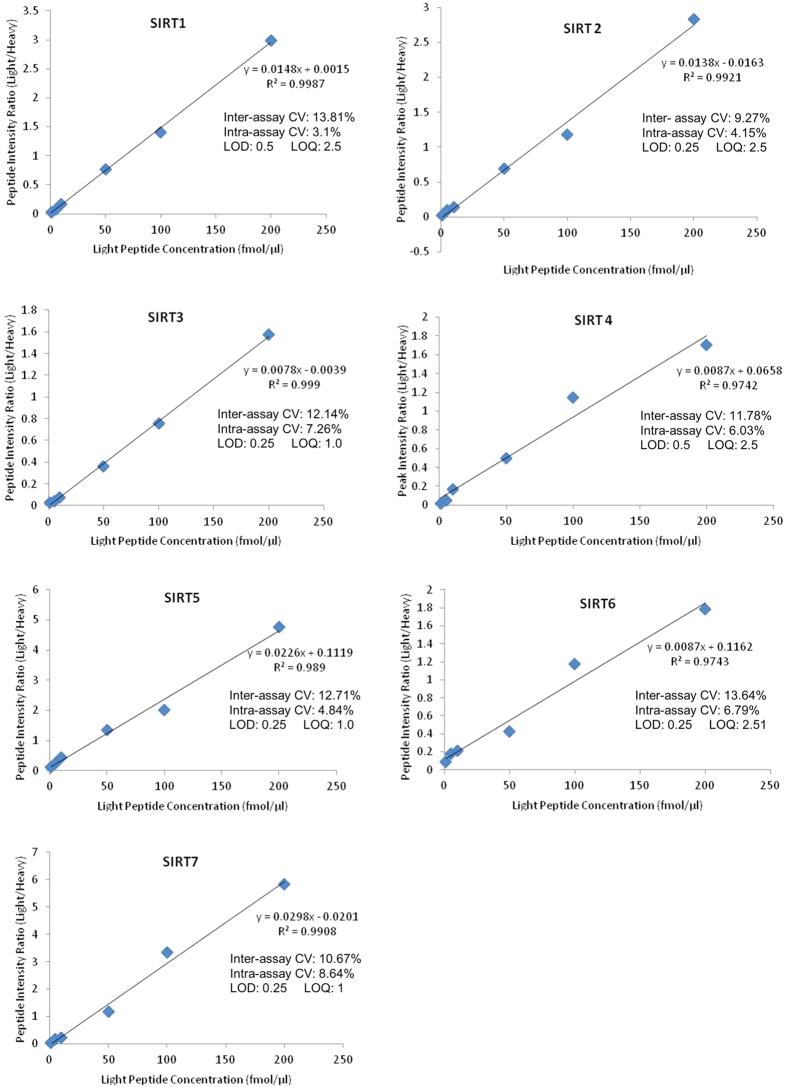
Figure 1. Sirtuin peptide standard curves, variance and limits of detection and quantification.
Sirtuin peptide standard curves (average of the peak area ratios for the two peptides, in triplicate for each sirtuin, with heavy peptide spike of 100 fmol/μl). Both inter- and intra-assay variance were calculated for three replicates and the LOD and LOQ are shown in fmol/ul. CVs calculated using peptide peak area ratios (light/heavy) at the 100 fmol/μl peptide concentration level. Individual chromatograms for each of the 14 peptides can be found in Supplementary Figure S1.

