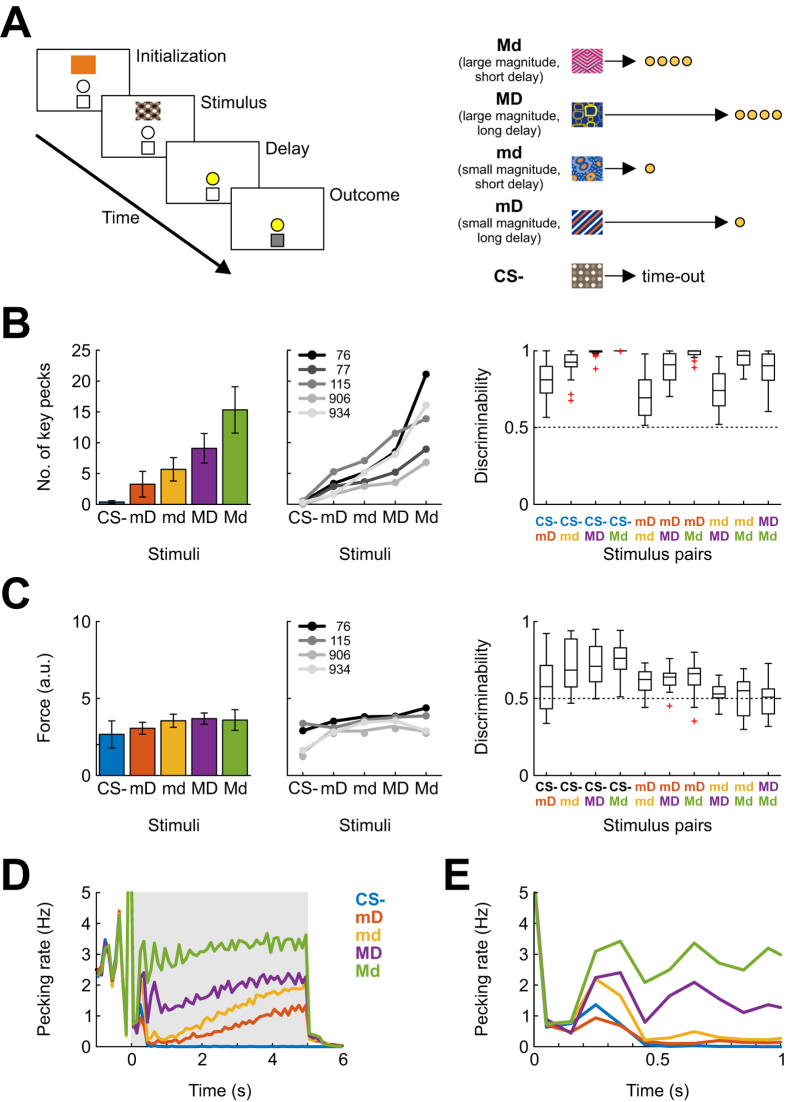
Figure 1. Experimental paradigm and behavioral results.
(A) Left: Trial outline. Following an intertrial-interval, the initialization stimulus was presented for at least 2 s, after which the first registered key peck initiated the trial. One of five stimuli was then presented for 5 s, during which no behavioral response was required. The sample was then extinguished, followed by either 1) a variable delay (short or long), and a variable reward period during which food was accessible via a food hopper for a short or long period of time, or 2) a 2 s time-out punishment period. Right: Stimuli and their associated reward properties. Stimuli signaled small (“m”) or large (“M”) magnitude of an upcoming reward (duration of food hopper activation), and a small (“d”) or large (“D”) delay until the reward delivery. The most rewarding stimulus Md thus predicted a large reward after a short delay. Rewards were delivered with 50% probability; in case of a reward omission, the delay was increased by the designated feeding time. Brown circles represent grain. Pictorial stimuli shown are similar to the ones used. (B) Left: Mean frequency of responses emitted at the conditioned stimuli across all sessions and subjects (mean +/− SD). Middle: Means for individual subjects (across all sessions) Right: Pairwise stimulus discriminabilities computed as the area under the ROC curve for response frequencies across all subjects and recording sessions. (C) As in B, but using force of pecking responses rather than frequency. (D) Pecking rate during the stimulus presentation phase, averaged across all animals and sessions and plotted in non-overlapping 100-ms bins, shown separately for each visual stimulus. (E) As in (D), but showing only data for the first second following stimulus onset.

