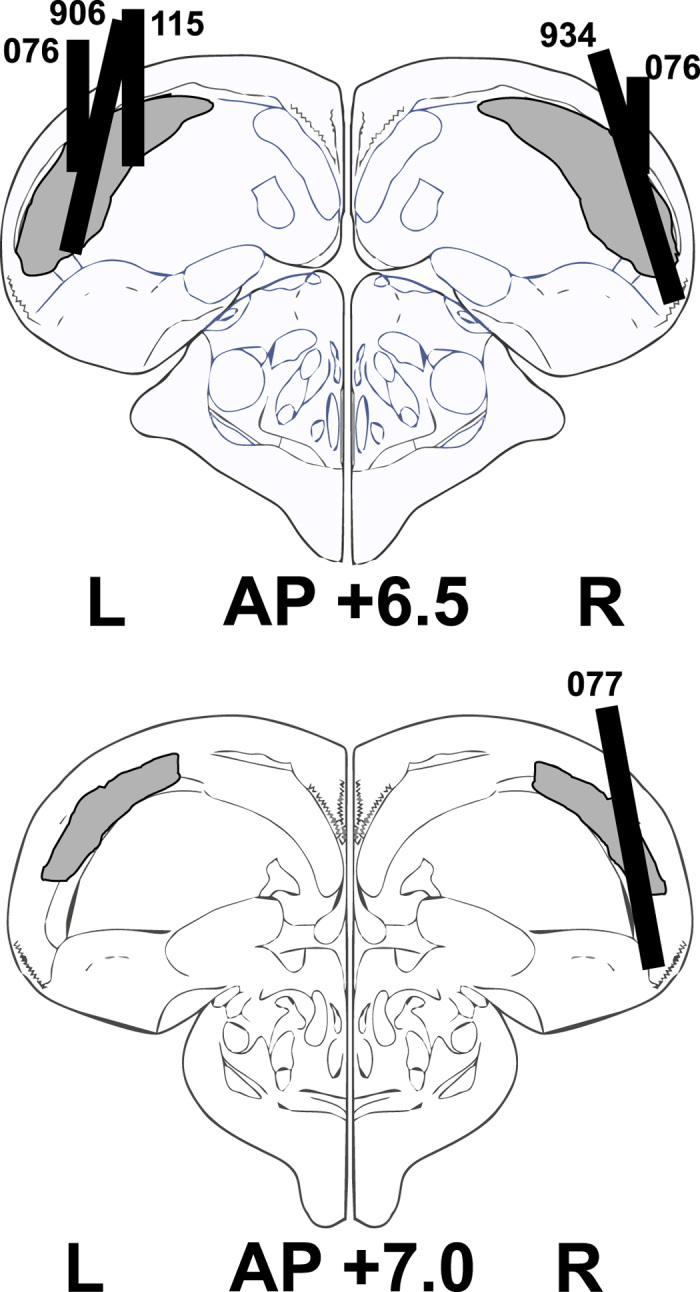
Figure 2. Histological reconstruction of electrode tracks.

Sketch shows a coronal section through the pigeon brain at anterior-posterior level of +6.5 mm. Gray shading indicates the NCL as delineated by Herold et al.15. Black bars indicate electrode tracks, numbers indicate subjects. Brain drawings were performed using CorelDRAW Graphics Suite X5 (http://www.coreldraw.com) and are based on Karten, Harvey J, and William Hodos, “A Stereotaxic Atlas of the Brain of the Pigeon (Columba Livia)”, pp. 82, 86, © 1967 The Johns Hopkins Press60. Adapted and reprinted with permission of Johns Hopkins University Press.
