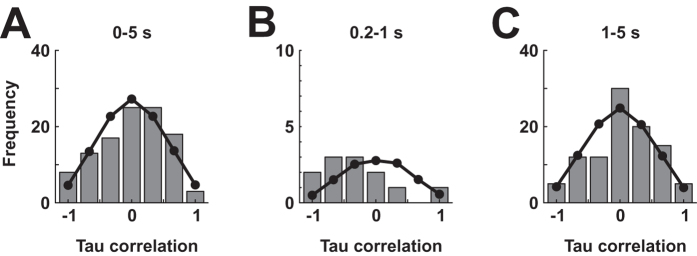
Figure 5. Population analysis.
(A) Distribution of tau correlation coefficients between behavioral and neuronal responses for all significantly stimulus-modulated neurons (gray bars), computed over the entire duration of the stimulus presentation phase. The black line represents frequencies expected by chance, as obtained from computer simulations. (B) As in (A), but computed from spikes and key pecks registered between 0.1-1 s after stimulus onset. (C) As in (A), but using data only from 1-5 seconds during stimulus presentation.

