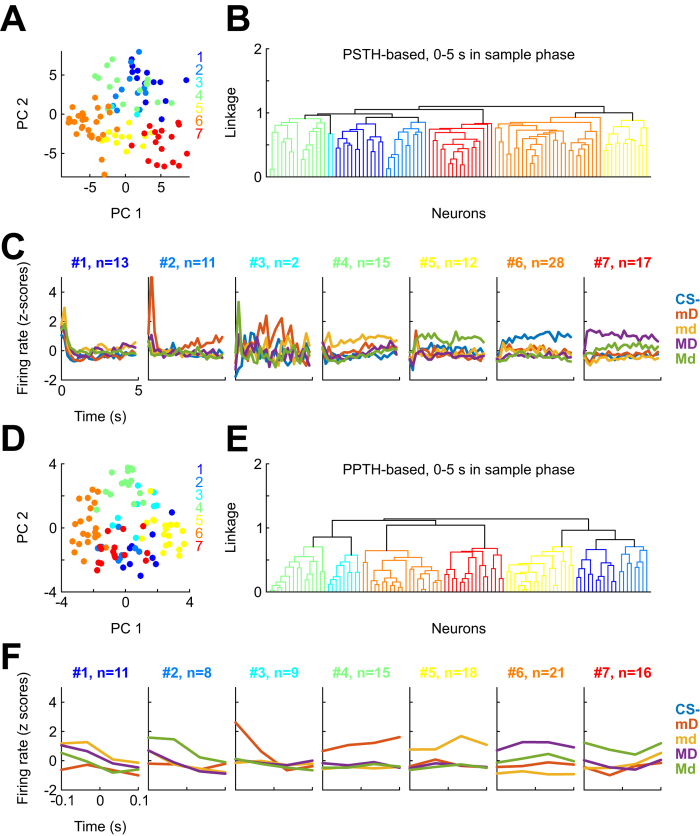
Figure 6. Cluster analysis.
(A) Scores of the first two principal components for each of 98 neurons showing stimulus discriminability η2 > 0.1, obtained after z-transforming five concatenated 100-ms PSTHs (one for each stimulus). Color-coding corresponds to the clusters depicted in (B). (B) Dendrogram showing linkage between the neurons’ response patterns to the stimuli. Color code as in panel A. (C) Average PSTHs for each stimulus (color-coded) for all neurons in each of the seven clusters shown in (B). Panel titles indicate cluster ID and the number of neurons in the cluster. (D,E,F) Same as (A,B,C), but using PPTHs (4 bins of 50 ms, ±100 ms relative to key pecks) as the basis for clustering.

