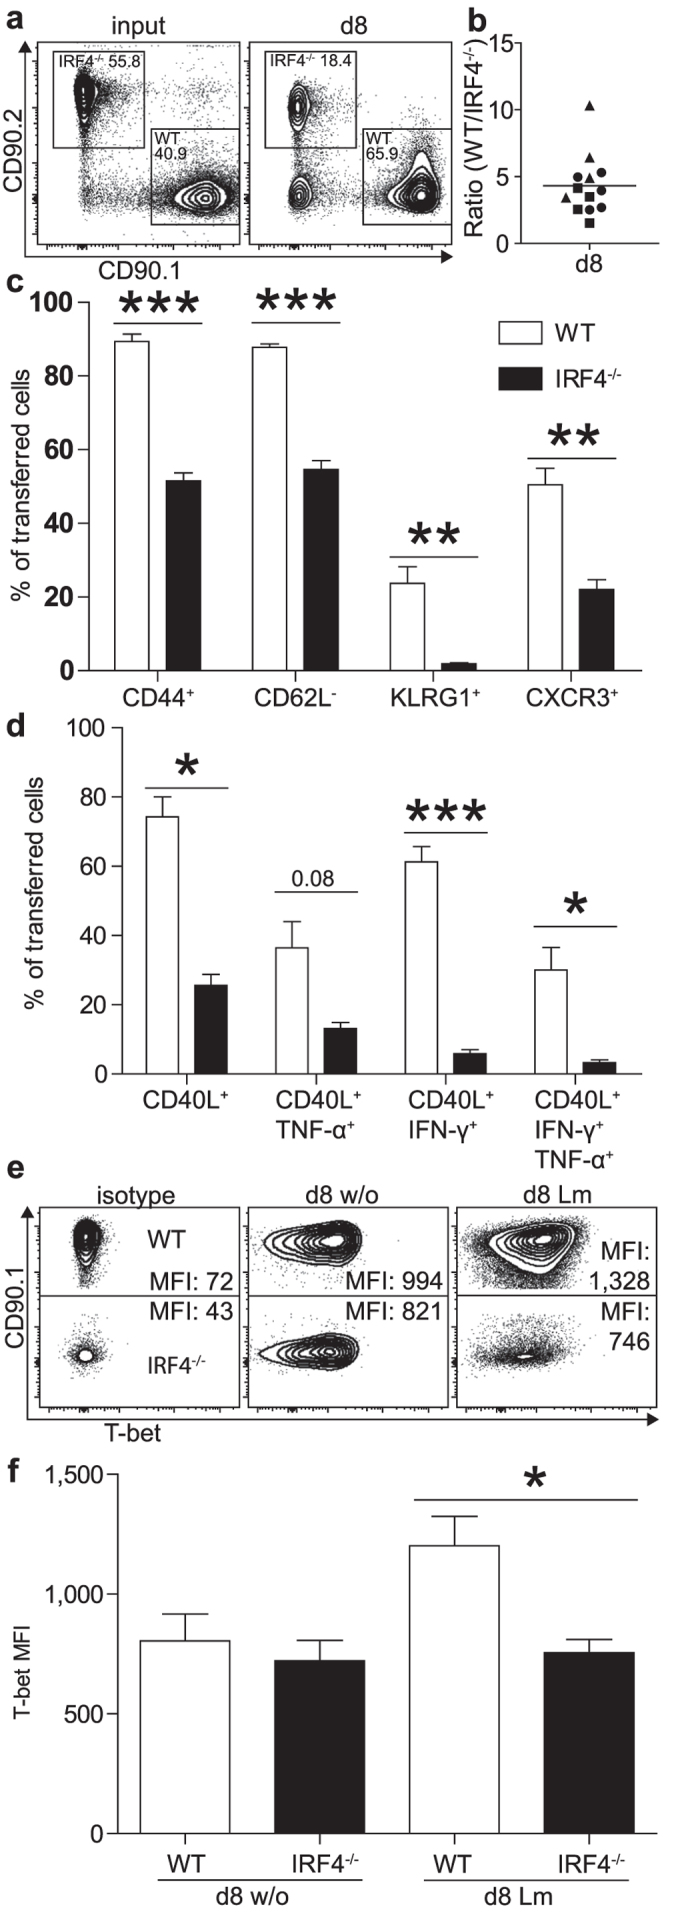
Figure 2. Impaired TH1 differentiation of IRF4−/− CD4+ T cells.

Purified CD4+ T cells from CD90.1+CD90.2− WT and CD90.1−CD90.2+ IRF4−/− mice were mixed in a 1:1 ratio and 2 × 10⁶ cells were i.v. transferred into RAG1−/− mice, which had been infected with 105 Lm 4 h earlier. Eight days post infection, spleen cells of mice were analyzed. (a) Representative CD90.1/CD90.2 dot blots of CD4+ T cells at the time point of transfer (input) and at d8 post infection. (b) Normalized ratio of WT and IRF4−/− CD4+ T cells. The figure shows results for individual mice combined from 3 experiments and the mean. (c) Surface expression of CD44, CD62L, KLRG1 and CXCR3 on transferred CD4+ T cells. (d) CD40L, TNF-α, and IFN-γ expression of transferred CD4+ T cells from spleens of infected mice following stimulation with PMA/ionomycin. (e) Representative intracellular T-bet staining for transferred cells (MFI mean fluorescence intensity). (f) T-bet expression in WT and IRF4−/− CD4+ T cells following transfer and with or without infection. (c,d,f) Show mean ± SEM for 4 individually analyzed mice per group. Results are representative for 3 independent experiments (with the exception of results for CXCR3 which are derived from one experiment only).
