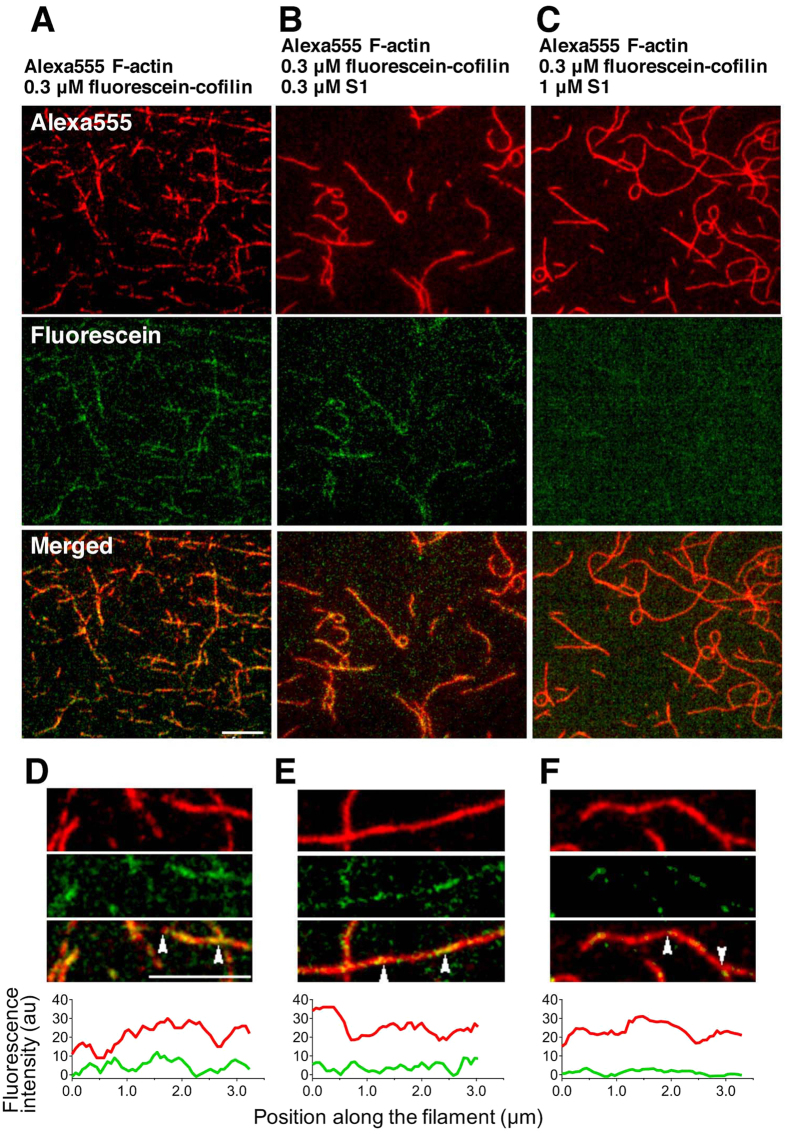
Figure 3. TIRF microscopic observation of inhibitory effects of sk S1 on binding of chicken cofilin to sk actin filament in presence of 0.1 mM ATP.
(A–C) are fluorescence images of Alexa555-sk actin filaments and fluorescein-cofilin and the merge image, captured 10 min after the addition of 0.3 μM fluorescein-cofilin without (A) or with 0.3 μM (B) or 1 μM S1 (C). Bar: 5 μm. (D–F) are enlarged views of a different field of the same sample as (A–C), respectively. The top and middle rows show Alexa555 and fluorescein images, and the bottom row shows the merged image, respectively. Bar: 5 μm. The graphs at the bottom show fluorescence intensity profiles of Alexa555 (red) and fluorescein (green) after background subtraction along the filament segments flanked by the two arrowheads in the merged images immediately above.

