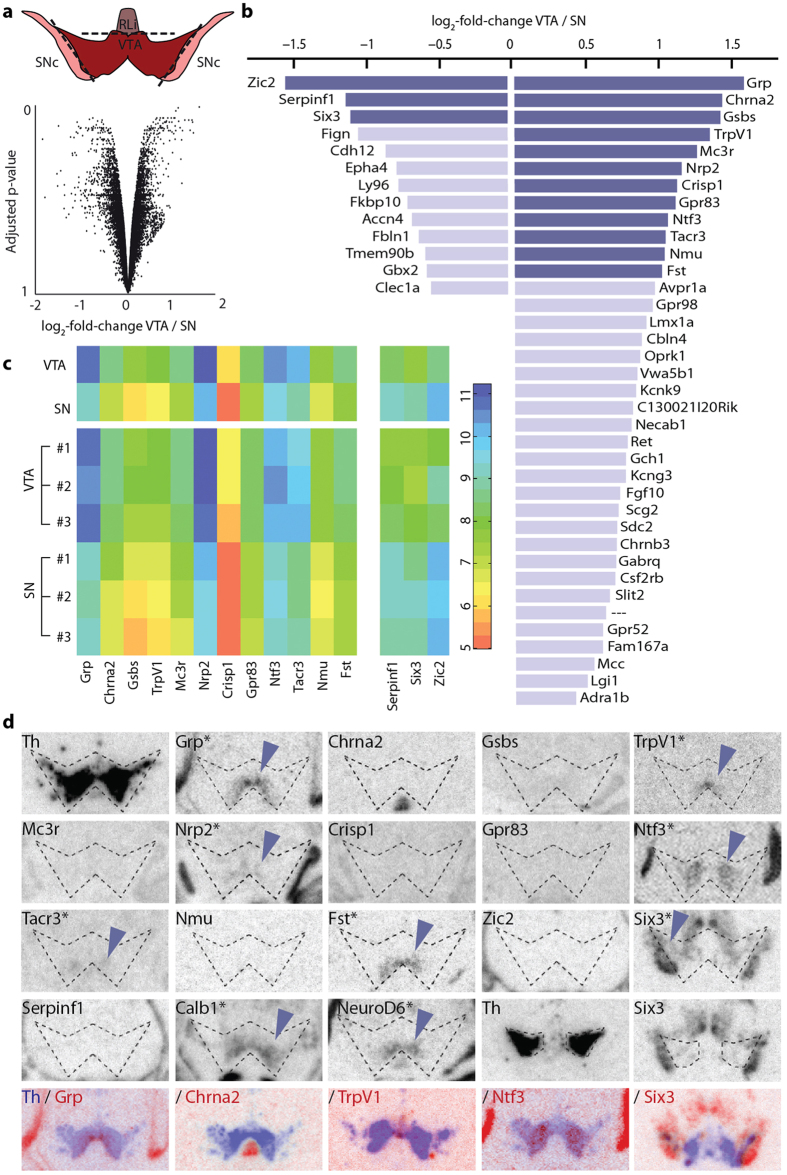
Figure 1. Identification of candidate genes with expression patterns restricted to either VTA or SNc.
(a) Tissue obtained from P3 Dat-CretdTom mice (n = 3) was separated into VTA, SNc and RLi (top) and VTA and SNc subjected to microarray analysis. Scatterplot of genes analyzed in the microarray, plotted by expression differences and adjusted p-value (bottom). Positive values represent genes upregulated in the VTA, negative values upregulation in the SNc. (b) Overview of the 50 genes with highest adjusted p-value, sorted according to difference in expression in VTA and SNc. Genes in dark blue were used for further analysis. (c) Heatmap of genes with at least log2-fold difference between VTA and SNc (n = 3) (top) and within the individual samples (bottom). (d) Representative images of oligo in situ hybridization for different genes in the ventral midbrain of P3 C57BL/6 mice with putative borders of the Th-positive cell population (dotted lines) as guidance. Rows one to three and first three images in row four represent the caudal midbrain; last two images in row four depict more rostral levels. Row five represents overlays of candidate genes (blue) with adjacent Th slide (red) from the same mouse. Schematic illustrations were adapted from Paxinos, G. & Franklin, K. B. J.42. Abbreviations: RLi, rostral linear nucleus; SNc, substantia nigra pars compacta; VTA, ventral tegmental area.

