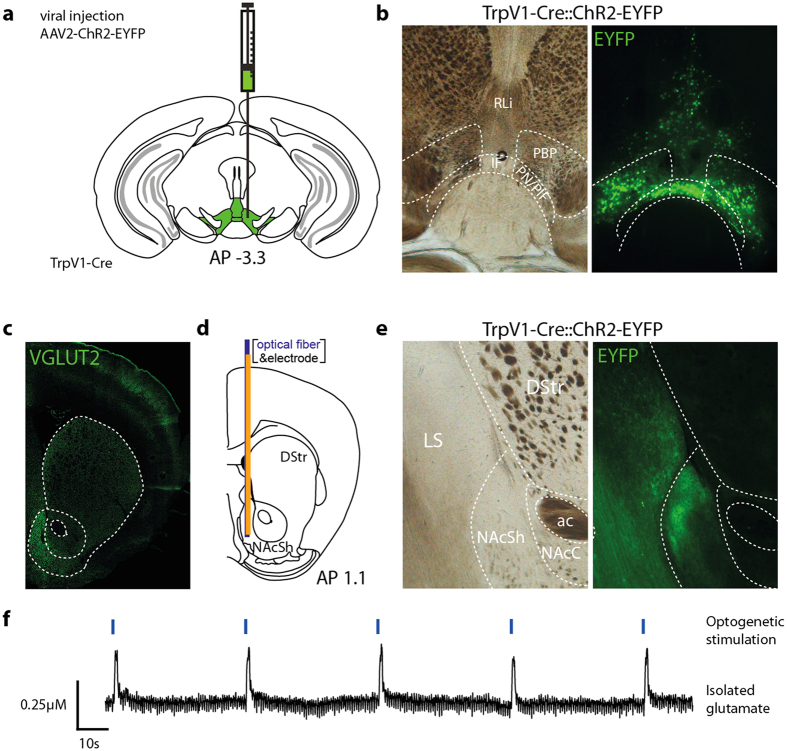
Figure 5. TrpV1-Cre positive projections release glutamate in the medial NAcSh upon optogenetic stimulation.
(a) Schematic illustration of viral injection into the VTA at AP −3.3, ML −0.4 DV −4.7 & −4.2 mm in TrpV1- Cretg/wt mice (illustration kindly provided by Dr N. Schweizer). (b) Representative example of the injection area (left) and ChR2-EYFP expression (right) in TrpV1-Cre mice. (c) VGLUT2-immunofluorescent analysis in the recording area. (d) Schematic illustration of the recording complex [microelectrode (orange) and optical fiber (blue)] placement in the NAcSh. (e) Representative example of the recording area (left) and ChR2-expression (right) in TrpV1-Cre mice. (f) Representative example of five consecutive blue light stimulations (40 Hz, 1 s) at 4 mW (blue marks, top) and the isolated glutamate response (black trace, bottom). Image in (c) was cropped from whole slides acquired with a microscope slide scanner. Schematic illustrations were adapted from Paxinos, G. & Franklin, K. B. J.42. Abbreviations: ac: anterior commissure; DStr: dorsal striatum; EYFP: enhanced yellow fluorescent protein; IF, interfascicular nucleus; LS: lateral septum; NacC: nucleus accumbens core; NacSh: nucleus accumbens shell; PBP/VTAR, parabrachial nucleus + ventral tegmental area rostral part; PN/PIF, paranigral nucleus + parainterfascicular nucleus.

