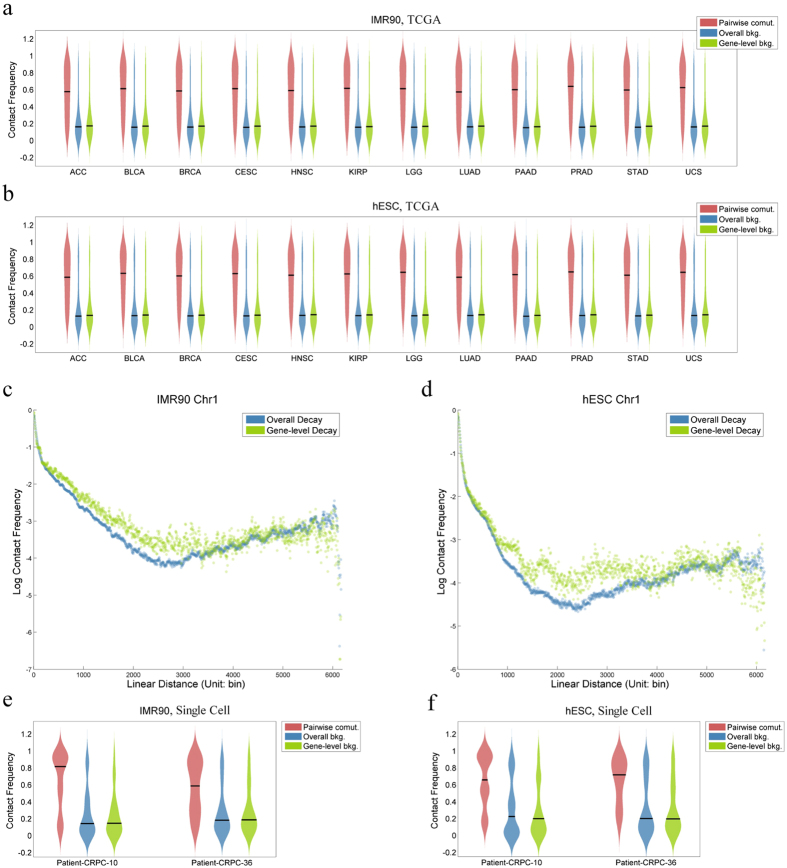
Figure 1. Spatial proximity of co-mutated gene pairs.
Comparison of the contact frequency distribution between co-mutation pairs and overall background and gene-level background contact frequencies. All pairwise co-mutated contact frequency (Pairwise comut.) distributions were significantly higher than the overall background (Overall bkg.) values and the gene-level background (Gene-level bkg.) values, with all P-values < 10−99. (a) The three contact frequency distribution violin plots of the 12 TCGA cancers, based on IMR90 Hi-C data. (b) The three contact frequency distribution violin plots of the 12 TCGA cancers, based on hESC Hi-C data. (c) The overall background contact frequency decay function over the bin-level linear distance on IMR90 chromosome 1. (d) The overall background and gene-level background contact frequency decay scatter plots over the bin-level linear distance on hESC chromosome 1. Comparison of the contact frequency distribution between co-mutation pairs and overall background contact frequency and gene-level background contact frequency within single cells from two patients with prostate cancer based on IMR90 (e) and hESC Hi-C data (f).

