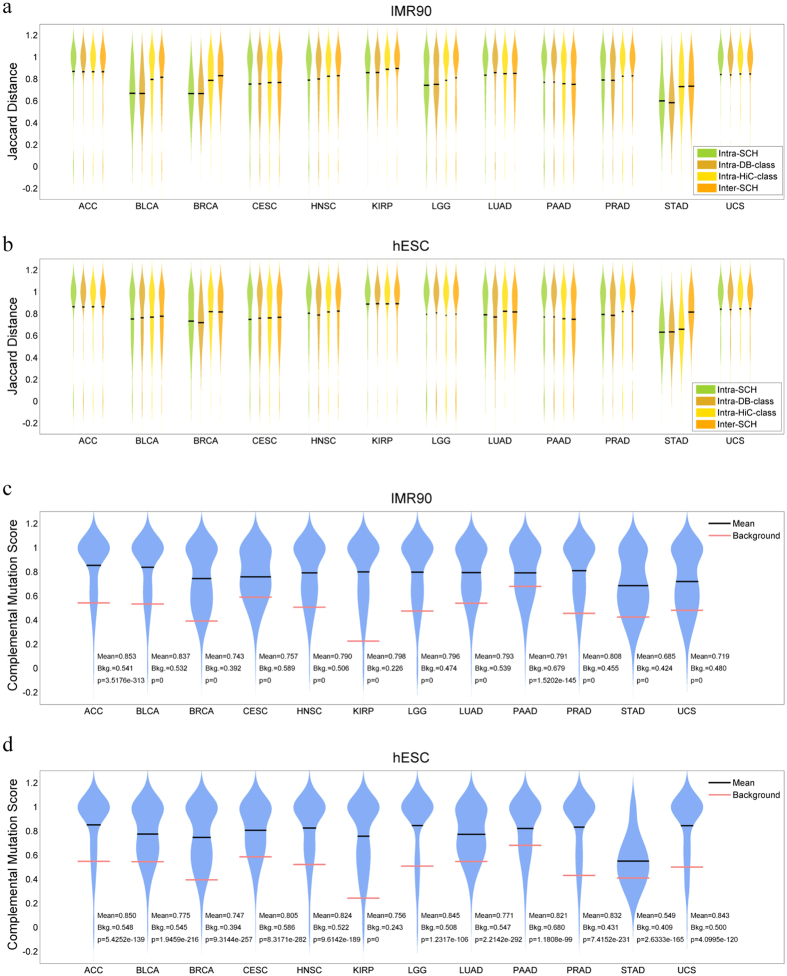
Figure 4. Mutational signatures in SCHs.
The distributions of Jaccard distance of mutational signatures within SCHs (intra-SCH) were statistically compared with intra-DB-class, intra-Hi-C-class and inter-SCH for the 12 TCGA cancer types, based on IMR90 (a) and hESC Hi-C data (b), respectively. The lower the Jaccard distances, the more similar the mutation types. The score distributions of complementary mutational signatures of gene pairs within SCHs from 12 TCGA cancer types were statistically compared to that of all mutated genes, which served as the background score (Bkg). The analysis was based on IMR90 (c) and hESC Hi-C data (d), respectively. The P-values are indicated for the corresponding cancer types. The lower the complementary mutation scores, the more complementary the mutations to are each other.

