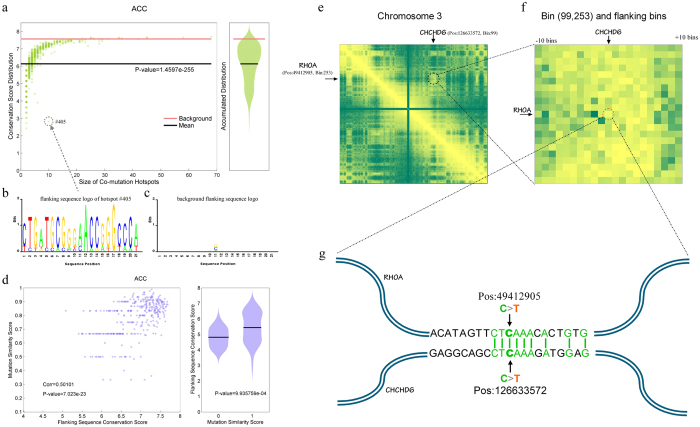
Figure 5. The conserved neighbouring sequences flanking the co-mutation points within SCHs.
A typical example depicting the conservation of the neighbouring sequence flanking co-mutation points within SCHs. This example was derived from adrenocortical carcinoma (ACC) and was based on IMR90 Hi-C data. (a) The relationship (left) between the SCH sizes (x-axis) and the mean conservation scores of these flanking sequences (y-axis), where each green dot represents the mean conservation score of flanking sequences within a given SCH, the black line indicates the overall mean value and the red line represents the mean value based on the background. The lower the scores, the more highly conserved the flanking sequences. The violin plot of the accumulated conservation scores marginalised over SCH sizes (right). (b) The logo of the most conserved flanking sequences of SCH #405 is shown as an example. The mutation position corresponds to the 11th nucleotide. (c) The logo of the background flanking sequences was used as the control. (d) The correlation between the mutational signature similarities and the flanking sequence conservation within SCHs of ACC based on IMR90 Hi-C data (left). The comparison between the conservation of the flanking sequence and mutation similarity within SCHs was scored as 0 and 1, where 0 means identical and 1 means distinct. (e–g) The mutational signatures and flanking sequences of both RHOA and CHCD6 within the corresponding bin of chromosome 3 showed conservation. The original heatmap (e) and the magnified 21-by-21 bin of the heatmap (f) showing the co-mutation of RHOA and CHCD6 within the same SCH. Their mutational signatures, positions and flanking sequences (g) are also shown.

