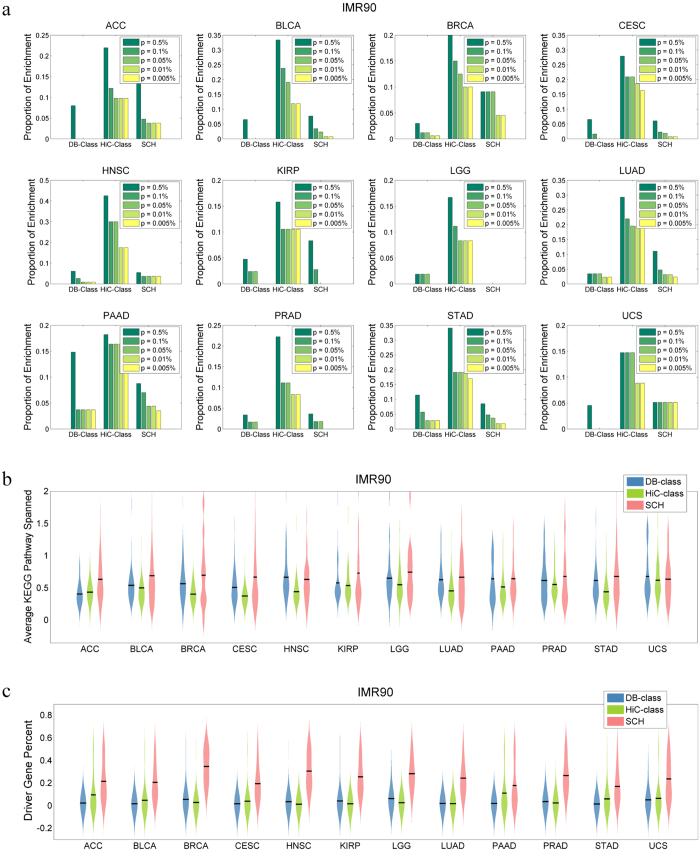
Figure 6. Pathway enrichment and cancer driver genes within SCHs.
(a) The proportions of KEGG signalling pathway enrichment among different gene clusters from the 12 TCGA databases (DB), IMR90 Hi-C data and SCHs (overlap) were statistically compared, with different significance cut-offs. The average KEGG pathways represented (b) and the percentages of cancer driver genes (c) among the three datasets were also statistically compared for the 12 TCGA cancer types.

