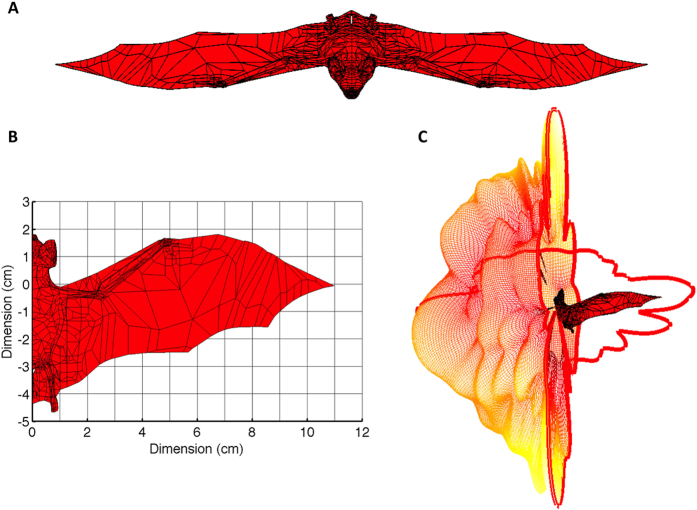
Figure 1. Modeling study of the radio-wave scatter from a bat.
(A) 3-D view of the topographical surface patch model for the Brazilian free-tailed bat used in our method-of-moments calculations to find the radar cross section (RCS) of the animal assuming a probing radar wavelength of 3 cm. (B) Detailed view of the model from above including dimensions. (C) Illustration of the full solid-angle vertical-polarization RCS pattern of the bat as a function of incident angle. Values corresponding to two planar cross-sections through the bat have been highlighted for the sake of reference. All images created using Matlab R2014a (http://www.mathworks.com/).

