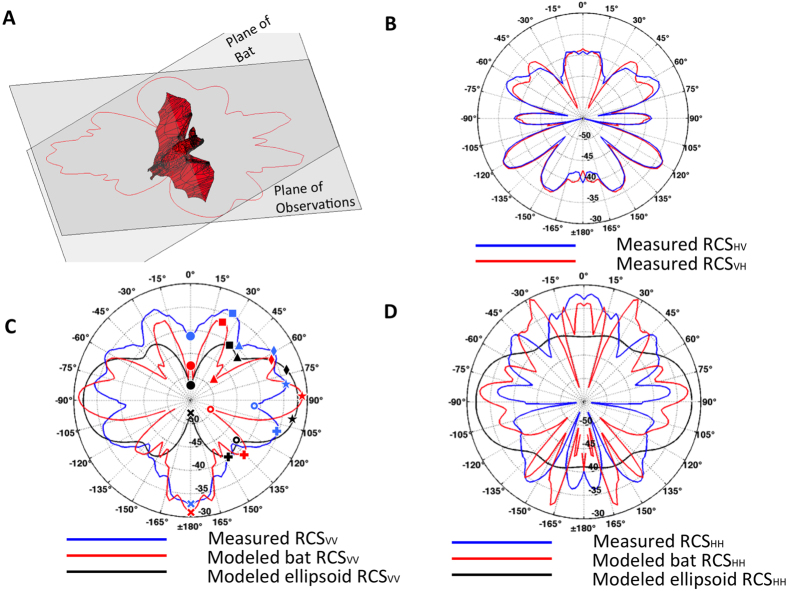
Figure 3. Comparison of observed and modeled polarimetric RCS components [dBsm, decibel value of the RCS relative to a reference value of 1 m2] of a Brazilian free-tailed bat at a 3-cm wavelength.
(A) Orientation of the measurement plane with respect to the bat specimen. (B) Cross-polar RCS measurements. (C) Vertical polarization RCS values of the bat from measurements (blue), modeling (red), and ellipsoidal approximation (black). Comparable morphological features are annotated on each curve (see text). (D) Horizontal polarization RCS values of the bat from measurements (blue), modeling (red), and ellipsoidal approximation (black). All images were created using Matlab R2014a (http://www.mathworks.com/).

