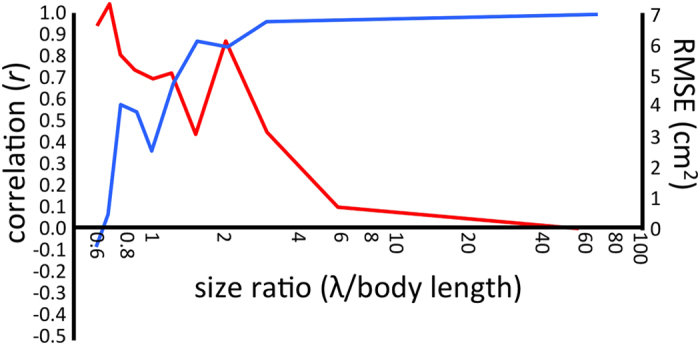
Figure 5. Similarity between anatomical and ellipsoidal bat models with respect to probing wavelength.

Pearson correlation coefficient (blue) and root-mean-square error (red) between the modeled horizontally-polarized RCSs as a function of size ratio. The RCS values around the 360 degrees of azimuth at the 0-degree elevation view angle are all included in the calculation. A body length of 5 cm is used to calculate size ratio.
