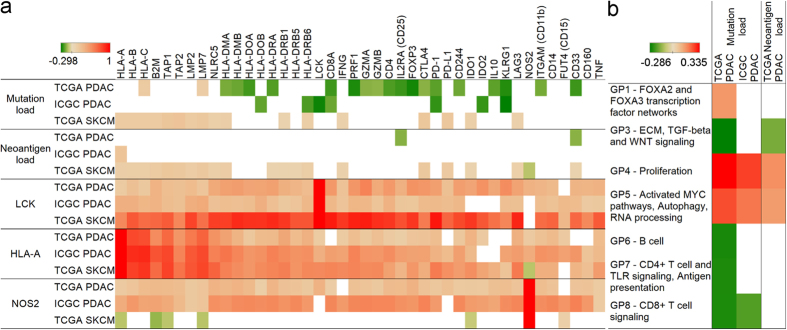
Figure 4. Mutation load in PDAC negatively correlates with T-cell activity.
Spearman’s rank correlation coefficients showing how mutation load (first row), neoantigen load (second row), and LCK, HLA-A, and NOS2 (rows 3–5) correlate with gene expressions related to class I and II antigen presentation, cytotoxic activity, immune checkpoints, Treg, and MDSC cells (panel a). Gene program scores related to proliferation, activated MYC pathways, autophagy, and RNA processing show positive, while B cell, CD4+ T cell and TLR signaling, antigen presentation, and CD8+ T cell signaling show negative correlations (panel b). Only p < 0.1 correlations are shown.

