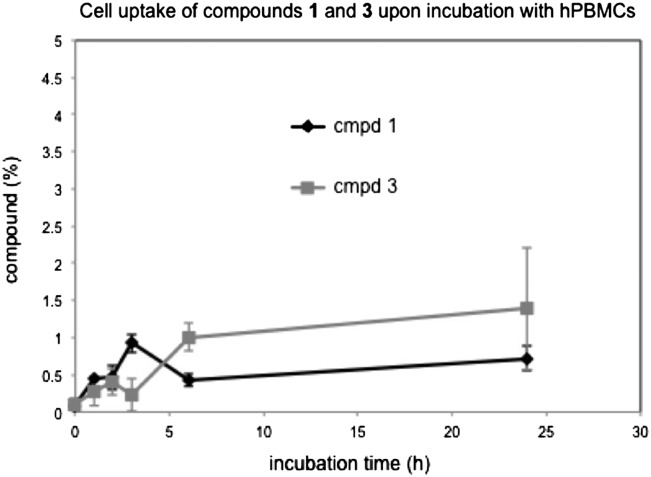
Fig. 10.
Cellular uptake of 5-FT UDP-Gal (1) and 5-FT UMP (3) into hPBMCs. Cells were incubated separately with either 1 (1 mM) or 3 (1 mM) over 24 h and samples taken at different time points. The concentrations of 1 and 3 in the cell pellet, after centrifugation and lysis, are shown as percentages of the total concentration used (1 mM). The concentration for 5-FT UDP-Gal 1 is based on the total peak area for both intact 1 and its degradation product 3 (see Fig. 9). Values are mean ± SEM from 4 independent experiments using hPBMCs from 2 human donors.

