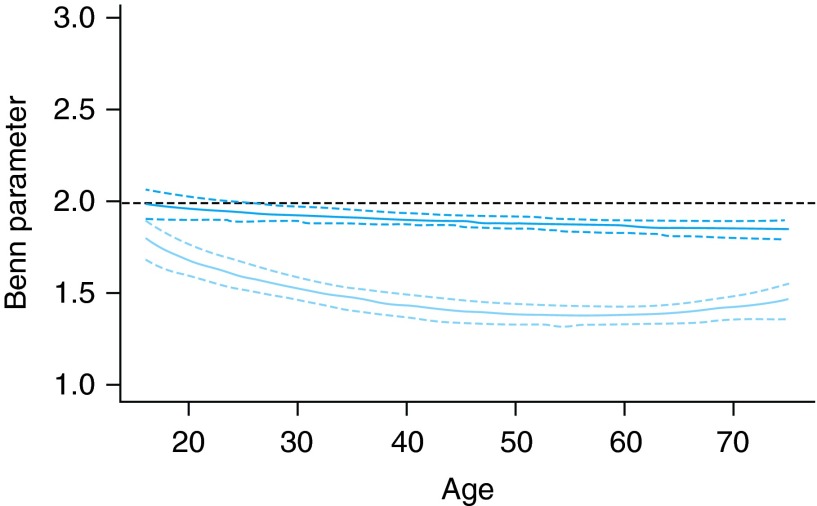
Fig. 2.
Benn parameter (relative change in predicted weight when height is increased by 1%) for various ages. Top line (dark blue), males; bottom line (light blue), females. Solid line, expected change; dashed line, 95% confidence limits. Interpretation: a Benn Index <2 implies taller people tend to have lower BMI.

