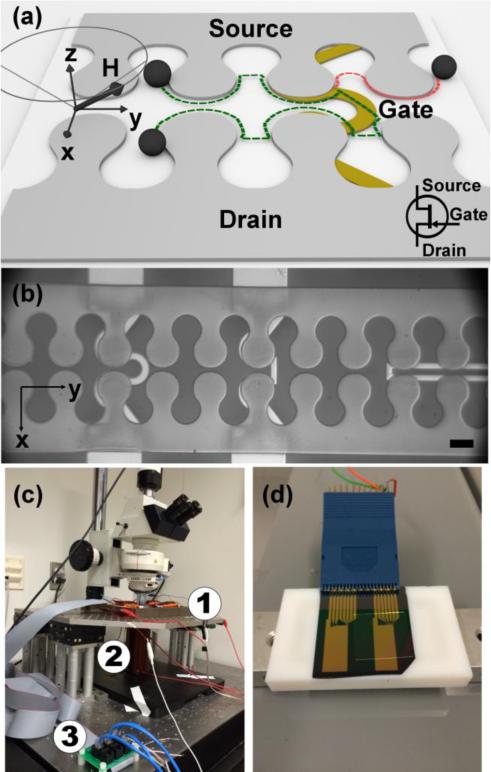
Figure 1. Magnetophoretic transistor and experimental setup.
Schematic of a sample transistor and particle trajectories when the transistor is operating in OFF mode (red dashed line) and ON mode (green dashed line) is illustrated in (a). Examples of fabricated transistors are shown in (b). Scale bar, 10 μm. The imaging station and magnetic field stage are shown in (c). The rotating field is produced by the coil (1), with another coil mounted underneath the platform (2). The rotating field and gate currents were controlled with a custom designed board (3). The chip is shown mounted in an IC test clip in (d).

