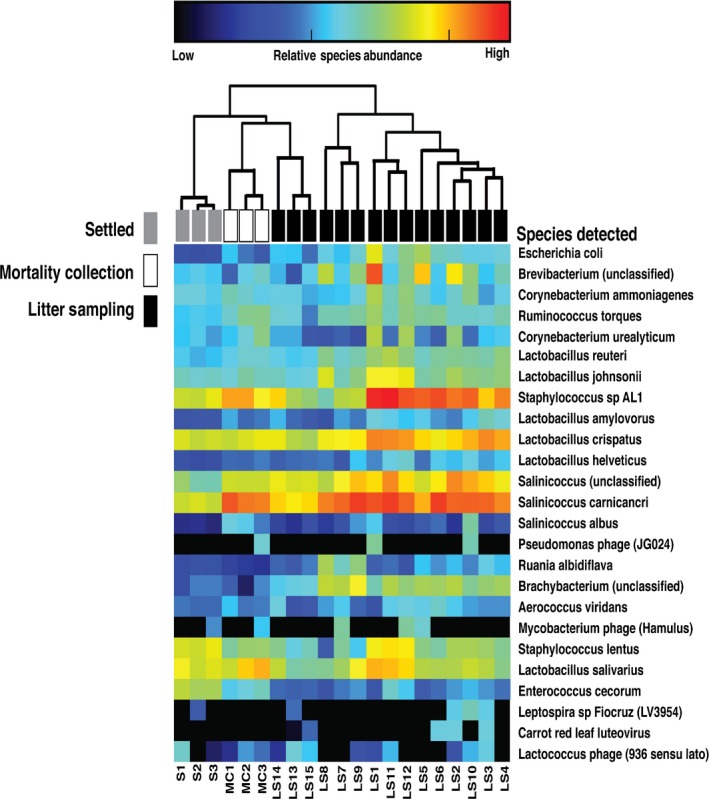
Figure 3.

Microbial relative abundance in aerosolized or settled poultry dust. Heat map was generated using MetaPhlAn2 and illustrates the 25 most abundant species in inhalable litter sampling dust (LS1‐15) (white), settled dust (SD1‐3) (grey), inhalable mortality collection dust (MC1‐3) (white) collected on broiler chicken farms. Columns represent the relationship between dust samples, and rows represent the relative abundance of species in the poultry dust.
