
Figure 5.
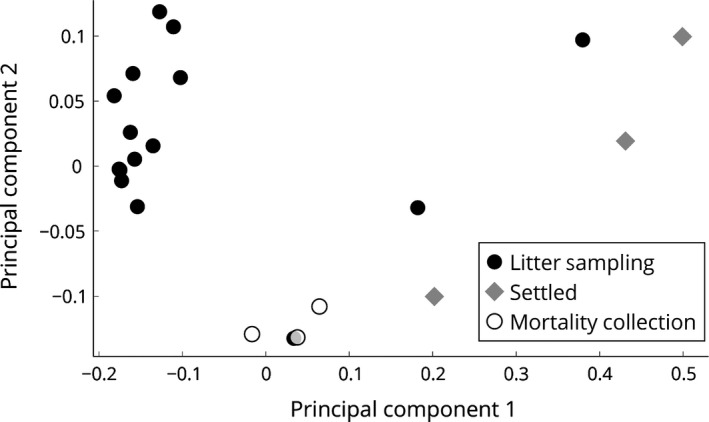
Relationship between the sources of poultry dust. Ordination graph was derived from the Bray‐Curtis dissimilarity matrix calculated in Python. Principal component analysis shows the distances between microbial compositions in inhalable litter sampling dust (black), settled dust (grey) and inhalable mortality collection dust (white). The distance between samples is proportional to their similarity of microbial composition.