Figure 2.

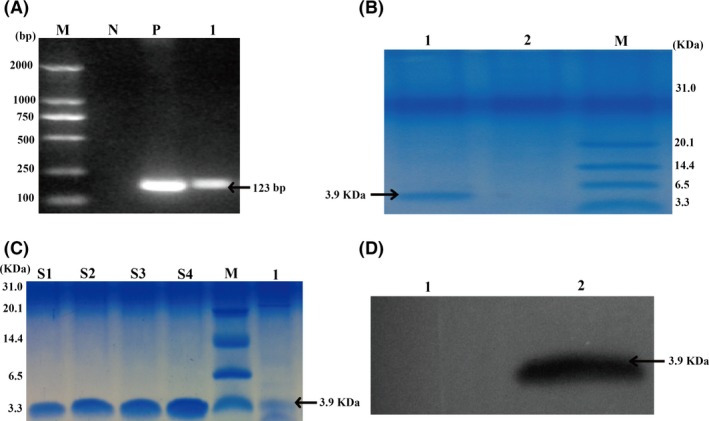
Identification of GLP‐2‐expressing recombinant S. cerevisiae (GLP2‐SC). (A) The PCR profile of recombinant S. cerevisiae (GLP2‐SC). Lane M: D2000 DNA marker (100–2000 bp); Lane N: negative control (ddH2O); Lane P: positive control (pYES2‐GLP‐2 from E. coli transformant); Lane 1: colonies of pYES2‐GLP‐2 from S. cerevisiae. (B) Tricine‐SDS‐PAGE analysis of GLP‐2 protein generated by recombinant S. cerevisiae (GLP2‐SC). Lane M: protein marker (3.3–31 kDa); Lane 1: cell lysates from S. cerevisiae transformed with GLP2 (GLP‐SC strain); Lane 2: cell lysates from S. cerevisiae transformed with the empty vector backbone (the EV‐SC strain). Recombinant GLP‐2 protein was indicated with the arrowheads at approximately 3.9 kDa. (C) Comparison of the intensities of recombinant human GLP‐2 protein (rh‐GLP2) with GLP‐2 produced by recombinant S. cerevisiae (GLP2‐SC) by tricine‐SDS‐PAGE analysis. Known concentrations of rh‐GLP2 were loaded on the same tricine‐SDS‐PAGE gel to estimate the approximate production of GLP‐2 protein by recombinant S. cerevisiae (GLP2‐SC). Lane M: the protein marker (3.3–31 kDa); Lane S1‐S4: rh‐GLP2 at 20.00, 25.00, 30.00 and 35.00 ng respectively. Lane 1: approximately 10 μL of cell lysates from recombinant S. cerevisiae (GLP2‐SC) was loaded per well. (D) Western blotting analysis of GLP‐2 protein produced by recombinant S. cerevisiae (GLP2‐SC). Lane 1: cell lysates from S. cerevisiae transformed with the empty vector backbone (the EV‐SC strain); Lane 2: cell lysates from S. cerevisiae transformed with GLP‐2 (the GLP‐SC strain); recombinant GLP‐2 protein is indicated with an arrowhead.
