Figure 1.

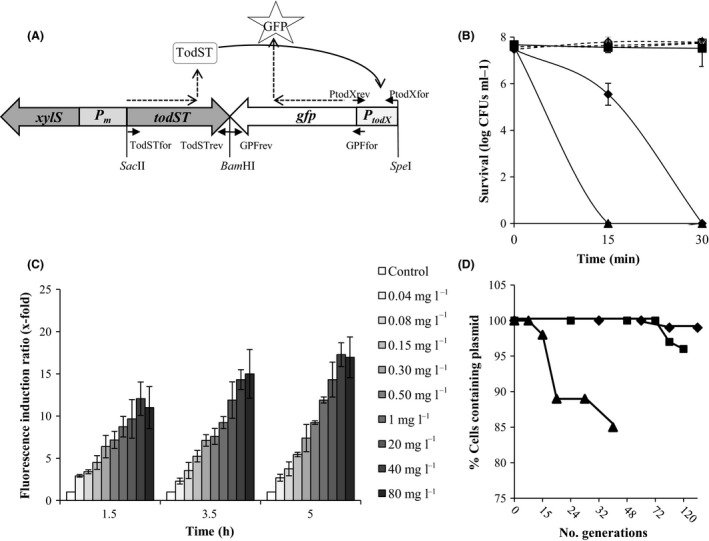
Structure and characterization of the biosensor. (A) Schematic representation of the BTX bioreporter in plasmid pKST‐1. Although the todST gene expression is under the control of the Pm promoter (inducible by benzoate or methyl‐benzoate) (Kessler et al., 1994), in our biosensors, basal transcription from the Pm promoter was high enough as to allow the induction of the system, and therefore, no benzoate or methyl‐benzoate were used in the experiments. In the presence of the effector (i.e. toluene), TodST proteins act over P todX promoter inducing the expression of the GFP protein. Small arrows indicate the location of the primers used in the amplification (above/below the arrow, the name of the primer was indicated). Location of the restriction enzymes introduced in the construction, SacII, Bam HI and SpeI are also depicted. (B) Solvent tolerance of the three host strains: Cultures were grown overnight and diluted to OD ≈ 0.1 next day on LB; cultures were grown until mid‐exponential phase (OD ≈ 0.8) and then divided into three flasks; 0.1% and 02% (v/v) toluene were added to two flasks and the third one was kept as control. Serial dilutions of samples taken 0, 15 and 30 min after toluene addition were drop plating to obtain the number of viable cells. Results of experiments with 0.1% toluene are not represented in the graphic. Triangles: Alcanivorax borkumensis SK2; diamonds: Pseudomonas putida KT2440; squares: P. putida DOT‐T1E. Discontinuous lines: samples without toluene; continuous lines: samples with 0.2% (v/v) toluene. (C) Optimum exposure time of the biosensor A. borkumensis SK2 (pKST‐1). Cultures were grown overnight on marine media ONR7a (Dyksterhouse et al., 1995) with sodium pyruvate 1% (v/v) plus streptomycin (50 μg ml−1) in an orbital shaker at 30°C and 200 rpm; next day the cultures were washed three times and cultivated in fresh media until they reached an OD 660 nm of 0.1. At this moment, different concentrations of toluene were added to each culture and samples were taken at different times. Fluorescent values are given as fluorescence induction ratio (fluorescence emitted in conditions of induction/ fluorescence emitted by the control culture without inducer). Fluorescence was measured in a LPS‐220B fluorometer (Photon Technology International). λex was 485 nm and λem 510 nm. Error bars mean the standard deviation of three experimental repeats. (D) Plasmid stability in the three host strains: triangles: A. borkumensis SK2; diamonds: P. putida KT2440; squares: P. putida DOT‐T1E. Overnight cultures of the three strains grown in their corresponding media (marine media plus sodium pyruvate for A. borkumensis SK2 and M9 minimal media with glucose for the two Pseudomonas strains) plus streptomycin were diluted to OD 660 nm of 0.1, washed once and transferred to fresh medium without antibiotic and grown at 30°C. Serial dilutions of the culture were plated every day. The percentage of cells containing pKST‐1 plasmid was calculated as follows: (CFUs in plates with antibiotic/CFUs in plates without antibiotic) ×100. Generation times for each strain were 197 min for A. borkumensis SK2, 45 min for P. putida KT2440 and 60 min for P. putida DOT‐T1E.
