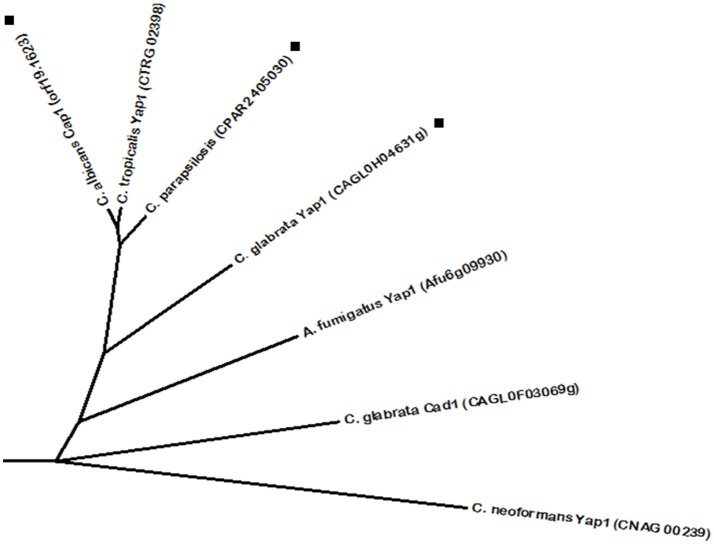
Figure 5.
Phylogenetic analysis of the C. albicans Cap1 homologs. Phylome predicted homologs of Cap1 are marked with (■). Unmarked branches represent additional proteins showing some degree of similarity identified by BLASTp (E < 10−50). The tree was constructed using the Molecular Evolutionary Genetics Analysis (MEGA 7) software (Kumar et al., 2016). Multiple alignments of the amino acid sequences were calculated by ClustalW algorithm (Sneath and Sokal, 1973). The tree is drawn to scale, with branch lengths in the same units as those of the evolutionary distances used to infer the phylogenetic tree. The evolutionary distances were computed using the JTT matrix-based method (Jones et al., 1992) and are in the units of the number of amino acid substitutions per site. The rate variation among sites was modeled with a gamma distribution (shape parameter = 1).

