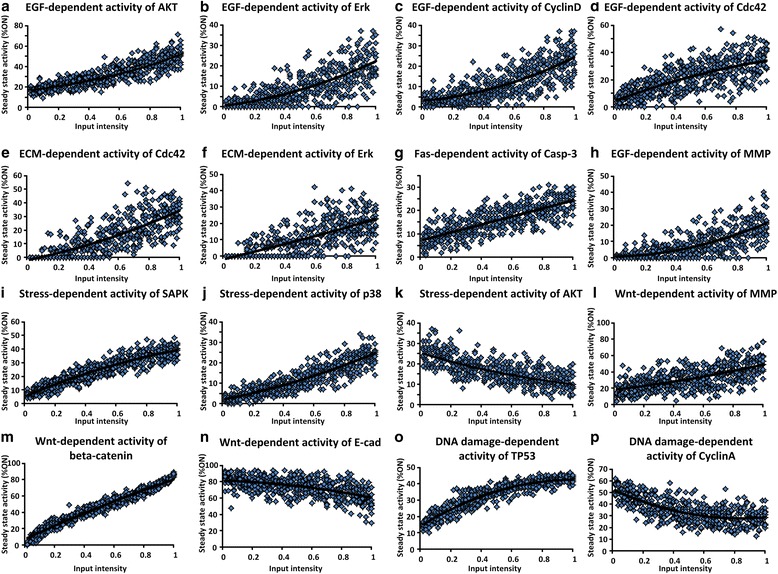
Fig. 2.

Qualitative input–output relationships in the Boolean model of human signaling network. a Positive relationship between EGF and AKT activation [62]. b Positive relationship between EGF and ERK activation [63]. c Positive relationship between EGF and CyclinD activation [34]. d Positive relationship between EGF and Cdc42 activation [64]. e Positive relationship between ECM and Cdc42 activation [65]. f Positive relationship between ECM and ERK activation [66]. g Positive relationship between Fas and Casp-3 activation [67]. h Activation of MMP by EGF [68]. i-j Stress-induced activation of SAPK and p38 [63, 69]. k Stress-induced inhibition of AKT [70]. l-m Wnt-induced activation of MMP and beta-catenin [71]. n Negative relationship between Wnt and E-cadherin [71]. o Positive relationship between DNA damage and TP53 activation [72]. p Negative relationship between DNA damage and CyclinA activation [73]. Note that the dose–response curves shown here are intended to demonstrate how the human signaling network model qualitatively reproduces the known input–output relationships over a wide range of inputs
