Figure 5.
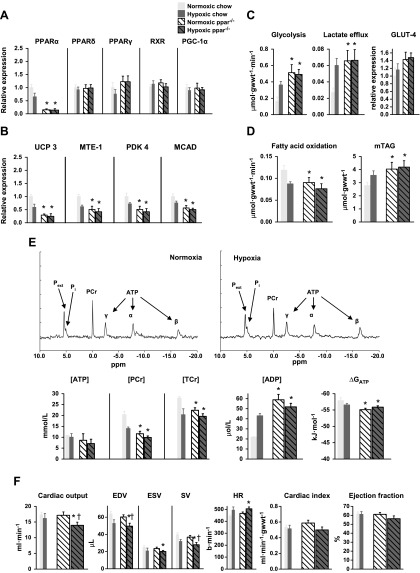
Effects of 3 wk of hypoxia in PPARα−/− mice, fed a chow (7.5% fat) diet, on cardiac PPARα and PPARδ mRNA, plus PPARγ, RXR, and PGC-1α proteins (A), PPARα controlled proteins (B), myocardial carbohydrate and lipid metabolism (C, D), [31P] MR spectra and high-energy phosphate metabolism (E), and in vivo cardiac function (F); minimum n = 6. Data in gray show the hypoxic response of chow-fed, wild-type mice for comparison. *P < 0.05 vs. normoxic chow-fed control; †P < 0.05 vs. normoxic PPARα−/− chow fed.

