
Figure 9.
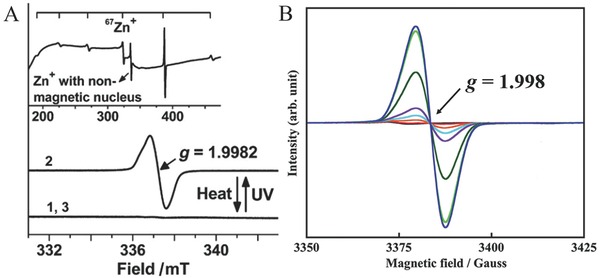
A) Room‐temperature X‐band ESR spectra for Zn2+–ZSM‐5 in vacuum (curve 1), the (Zn+, Zn2+)–ZSM‐5 sample (curve 2), and a reference Zn2+–ZSM‐5 sample (curve 3). The inset is the ESR spectrum of the 67(Zn+, Zn2+)–ZSM‐5 sample. B) ESR spectra of the ZnMFI irradiated at various wavelengths. A) Reproduced with permission.33 B) Reproduced with permission.36 Copyright 2013, American Chemical Society.