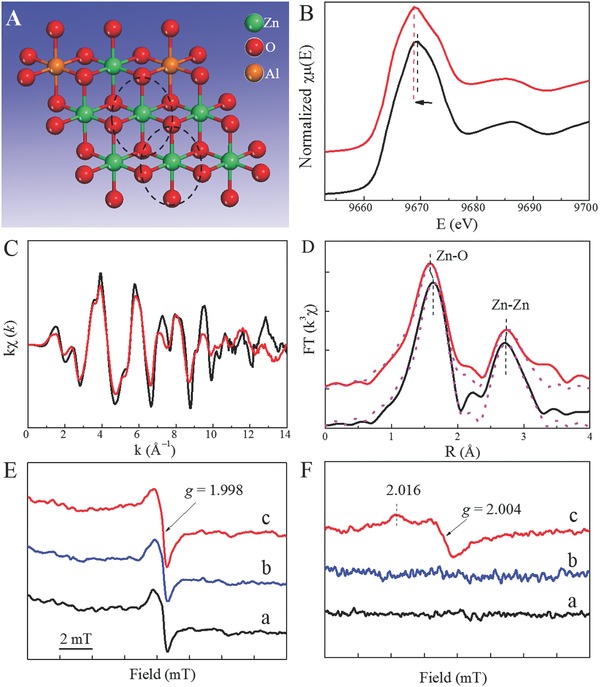
Figure 11.

A) Schematic structure model of a ZnAl–LDH single layer. B) Zn K‐edge XANES spectra, C) Zn K‐edge extended XANES oscillation functions k 2 χ (k), and D) magnitude of k 2‐weighted FT of Zn K‐edge EXAFS spectra for ZnAl‐nanosheet (red) and the counterpart ZnAl‐bulk (black). ESR spectra of E) ZnAl–LDH nanosheets and F) ZnAl–LDH bulk under different irradiation. Reproduced with permission.49
