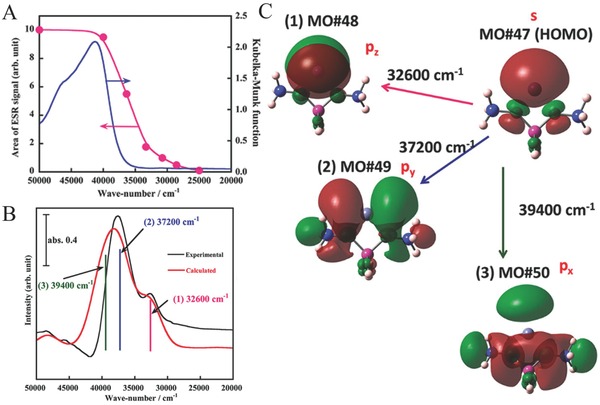
Figure 14.

A) Band areas of ESR signal corresponding to the respective spectra shown in Figure 9B, together with the absorption spectrum of Zn0(H+)2MFI‐95. B) Experimentally (black line) and theoretically (red line) UV–vis DR spectra of ZnI MFI. C) Respective components (from 1 to 3) obtained by the DFT calculations. Reproduced with permission.36 Copyright 2013, American Chemical Society.
