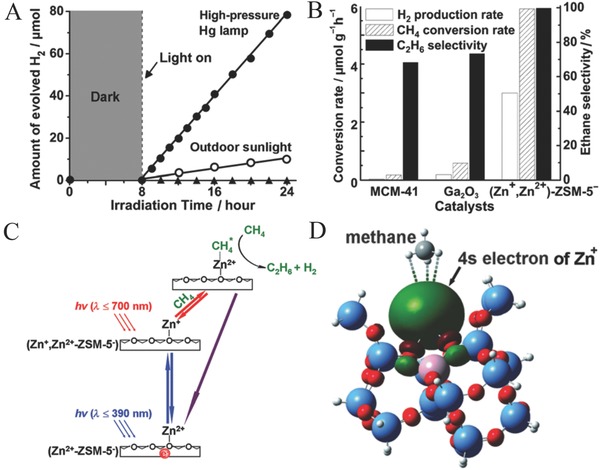
Figure 17.

A) Photocatalytic hydrogen evolution of NOCM reaction catalyzed by (Zn+, Zn2+)–ZSM‐5– catalyst. B) Methane and hydrogen production rate, and ethane selectivity obtained for the NOCM reaction catalyzed by different photocatalysts. C) Schematic energy diagram for the processes of the photocatalytic reaction. D) The optimized geometry of methane attracted by the Zn+ active site. Reproduced with permission.33
