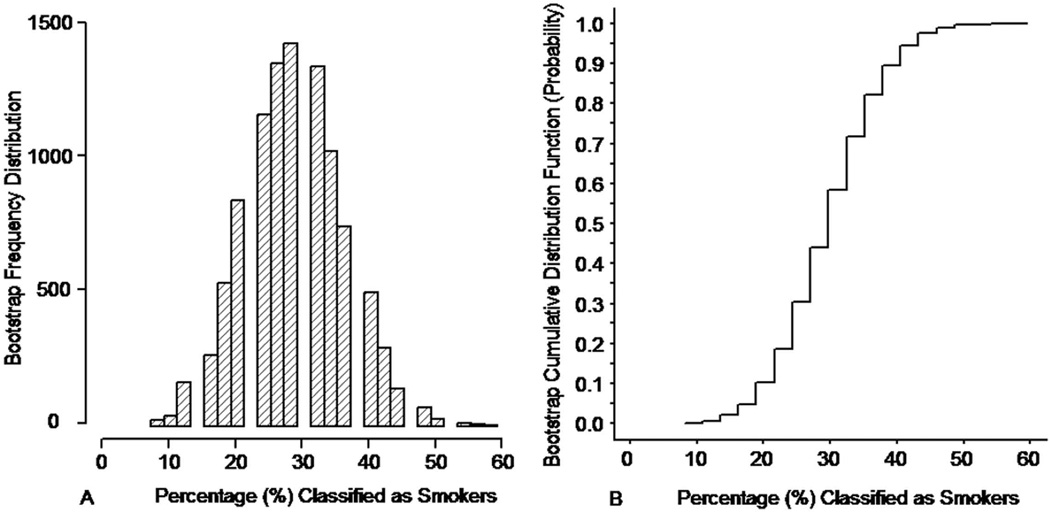
Figure 4.
(a) Bootstrap sampling frequency distribution and (b) bootstrap sampling cumulative distribution for the percentage of the exposed-to-secondhand smoke individuals in the target population who would be classified “smokers” based on their ADC AUC values and the optimum threshold classification rule. The bootstrap frequency distribution and the bootstrap cumulative distribution function were generated based on 10,000 bootstrap random samples of size 37 (i.e. sampling with replacement) drawn from the sample of 37 exposed to second hand smoke subjects.

