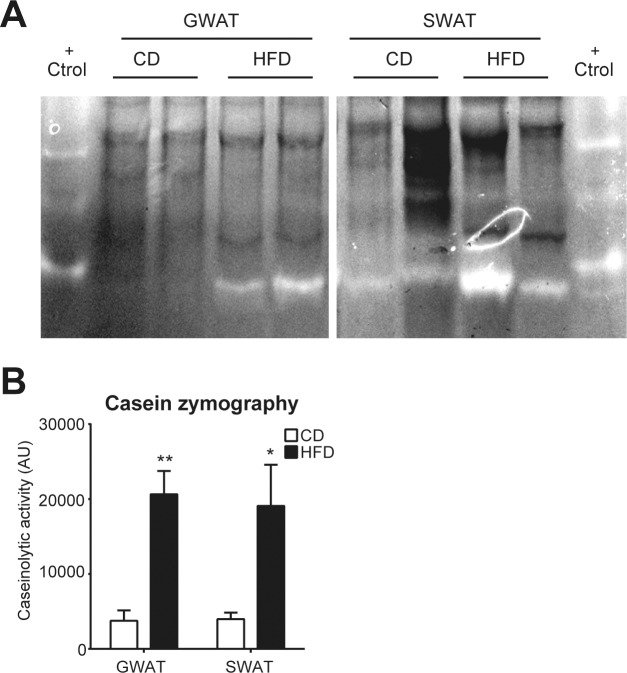
Figure 4.
Caseinolytic activity in white adipose tissue from diet-induced obese mice. (A) Representative image of 2 zymography (n = 4 mice per condition) are shown. (B) Quantification of caseinolytic activity by arbitrary units (AU) in GWAT and SWAT on CD and HFD. Results are expressed as mean ± SEM. * p < 0.05; ** p < 0.01.

