Figure 6.
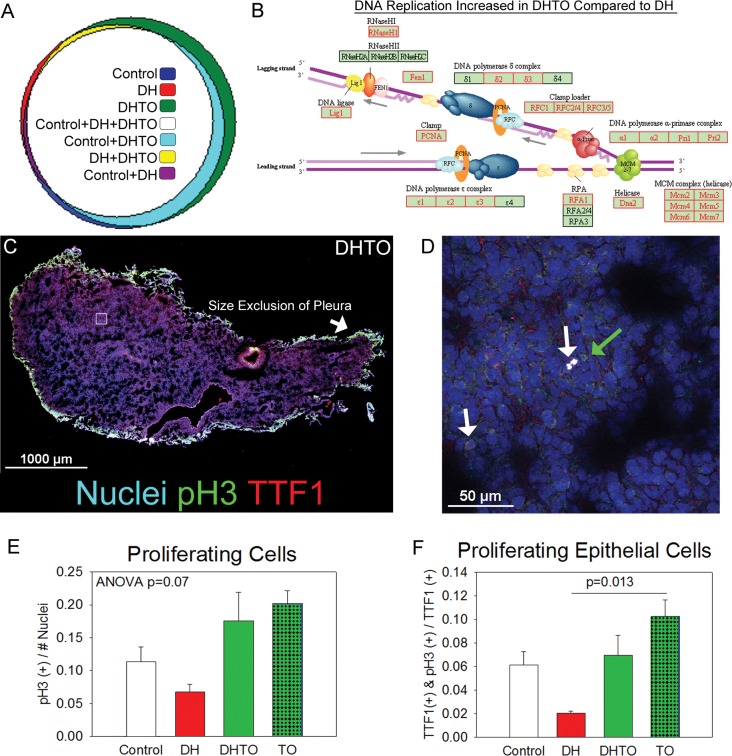
TO after DH increases DNA replication and cell division. (A) Among the 13,687 profiled genes, very few were uniquely expressed in control, DH, DH + control, or DH + DHTO. The majority of unique genes were expressed in DHTO (397) with a similar number in DHTO + Control (369). A proportionate Venn diagram was created using a web app from the Massachusetts Institute of Technology (31). (B) The only processes upregulated in DHTO compared with DH were DNA replication and elongation. Superimposing this gene expression profile onto the KEGG pathway for DNA replication demonstrate that expression of each component of the DNA replication complex is increased in DHTO (32,33). Red lettering indicates genes with increased expression levels. (C) Control, DH, DHTO and TO lung sections (n = 6–12) stained for the cell proliferation marker phospho-histone 3 (pH3, green) and thyroid transcription factor 1 (TTF1, Nkx-2.1, red) were imaged by tile scan and nuclear (blue) co-localization of pH3 and TTF1 quantified. The autofluorescent pleural surface was excluded by object size filtering. (D) Confocal imaging of a region of the prior image demonstrated nuclei expressing both markers (white arrows) and only pH3 (green arrow). In this representative image only strongly positive cells are highlighted. (E) Quantification of total number of pH3-positive nuclei demonstrated a 2-fold reduction in DH compared with control and a 3-fold increase in DHTO and TO compared with DH. (F) Limiting analysis to TTF1-positive cells, there was a 3-fold reduction in pH3-positive epithelial cells in DH compared with control with a 3.4-fold increase in DHTO compared with DH and an additional 47% increase in TO compared with DHTO.

