Figure 5.
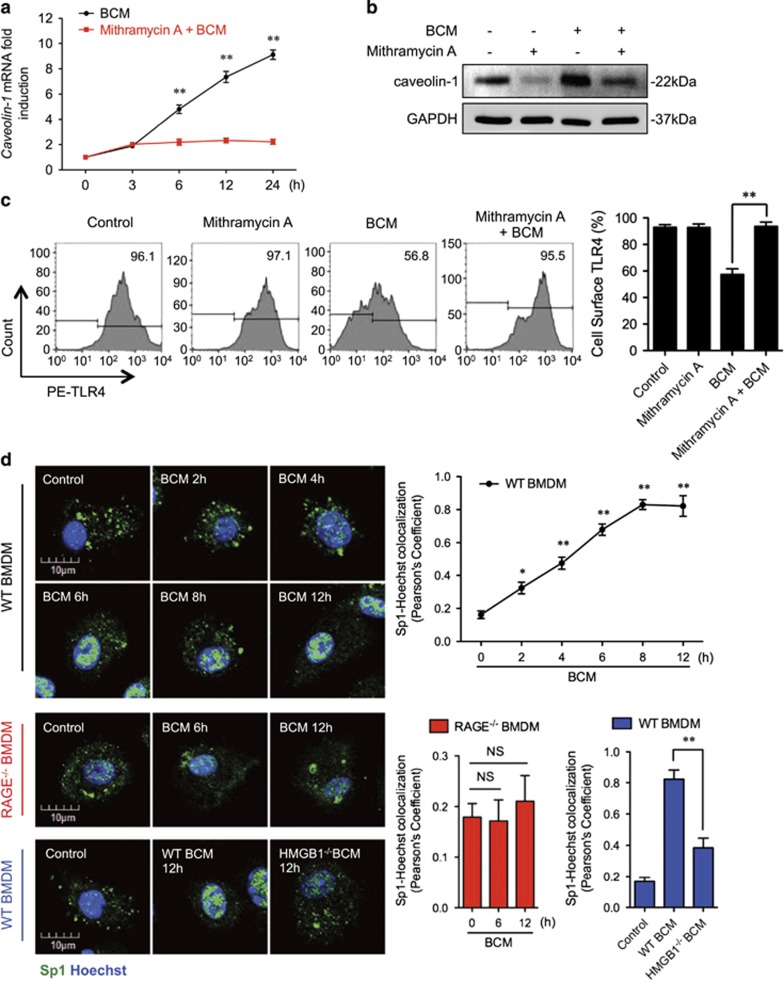
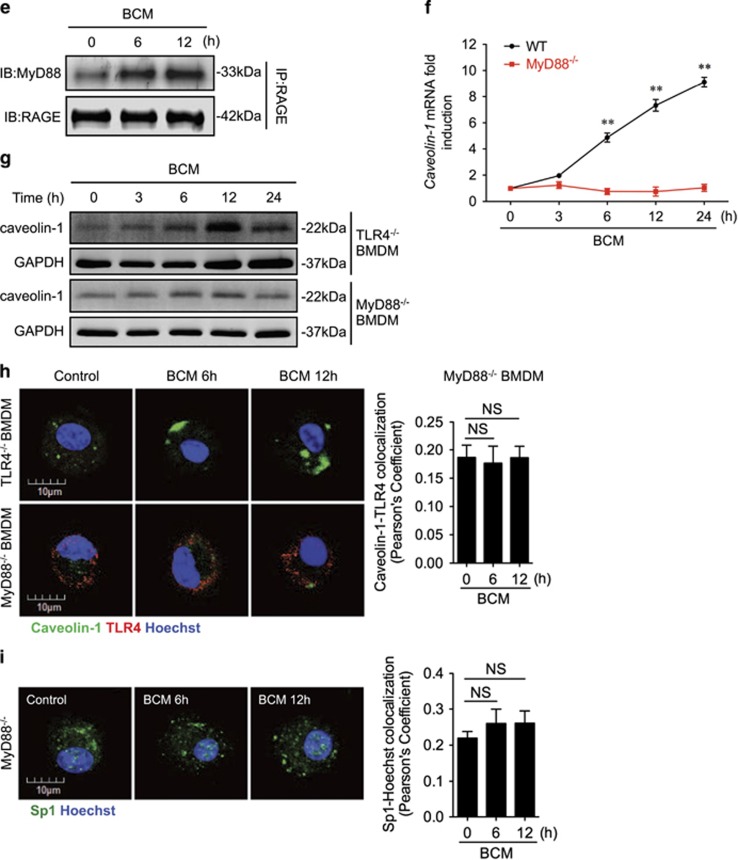
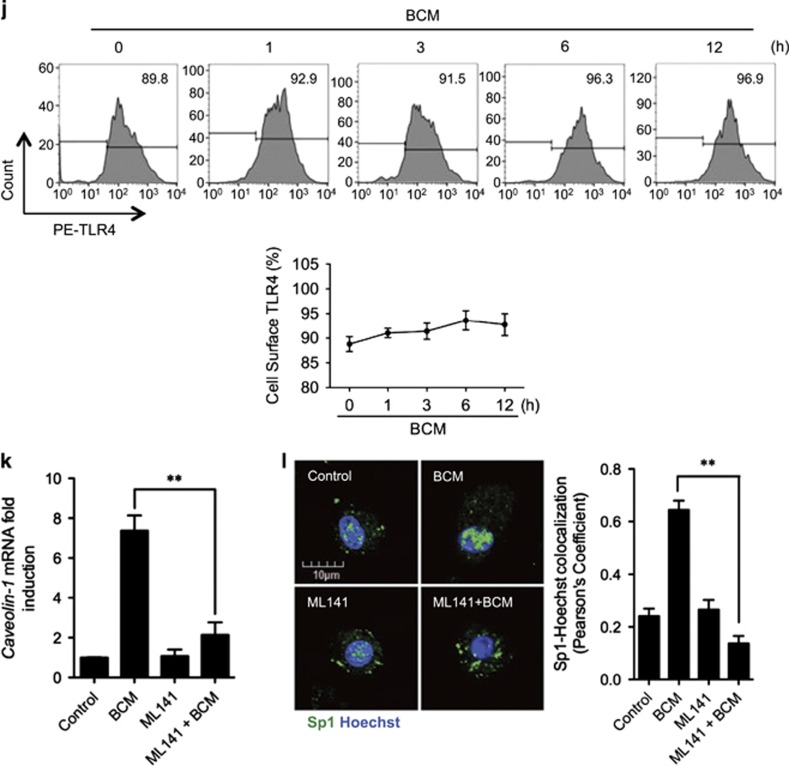
RAGE-MyD88 signaling-activated Sp1 upregulates caveolin-1 expression. (a–c) BMDM were pretreated with or without 30 μM of Mithramycin A, a Sp1-specific inhibitor, followed by treatment of 40 μl/ml of BCM for 12 h. The caveolin-1 mRNA (a) and protein (b) expression as well as the cell surface TLR4 expression (c) were measured by QRT-PCR, western blot, and flow cytometry, respectively. (d) Immunofluorescence images showing the nuclear translocation of transcriptional factor Sp1 in WT and RAGE−/− BMDM following the treatment of WT or HMGB1-lacking BCM (40 μl/ml) for 0–12 h. (e) WT BMDM were treated with BCM (40 μl/ml) for 0–12 h. The BMDM were then recovered for the detection of RAGE-MyD88 binding using immunoprecipitation and immunoblotting. (f) WT and MyD88−/− BMDM were treatment with BCM (40 μl/ml) for 12 h. The caveolin-1 mRNA level in the BMDM was measured by QRT-PCR. (g) TLR4−/− or MyD88−/− BMDM were stimulated by BCM (40 μl/ml) for 0–24 h, and the caveolin-1 protein expression in the BMDM was detected by western blot. (h) The images showing the Caveolin-1 (green) and TLR4 (red) localization in TLR4−/− BMDM and MyD88−/− BMDM treated with BCM (40 μl/ml) for 6 and 12 h. (i) MyD88−/− BMDM were stimulated by BCM (40 μl/ml) for 6 and 12 h, and the Sp1 (green) localization was visualized by confocal microscopy. (j) MyD88−/− BMDM were treated with BCM (40 μl/ml) for 0–12 h, and the cell surface expression of TLR4 was detected by flow cytometry. (k and l) WT BMDM were treated with BCM (40 μl/ml) for 12 h in the presence or absence of 35 μM of ML141, an inhibitor of Cdc42. The caveolin-1 mRNA (k) and Sp1 nuclear translocation (l) were measured by Q-RT-PCR and confocal immunofluorescence microscopy, respectively. All results are representative of three independent experiments. The graphs show the mean and S.E.M., n=3. **P<0.01 versus the control or compares between the indicated groups


