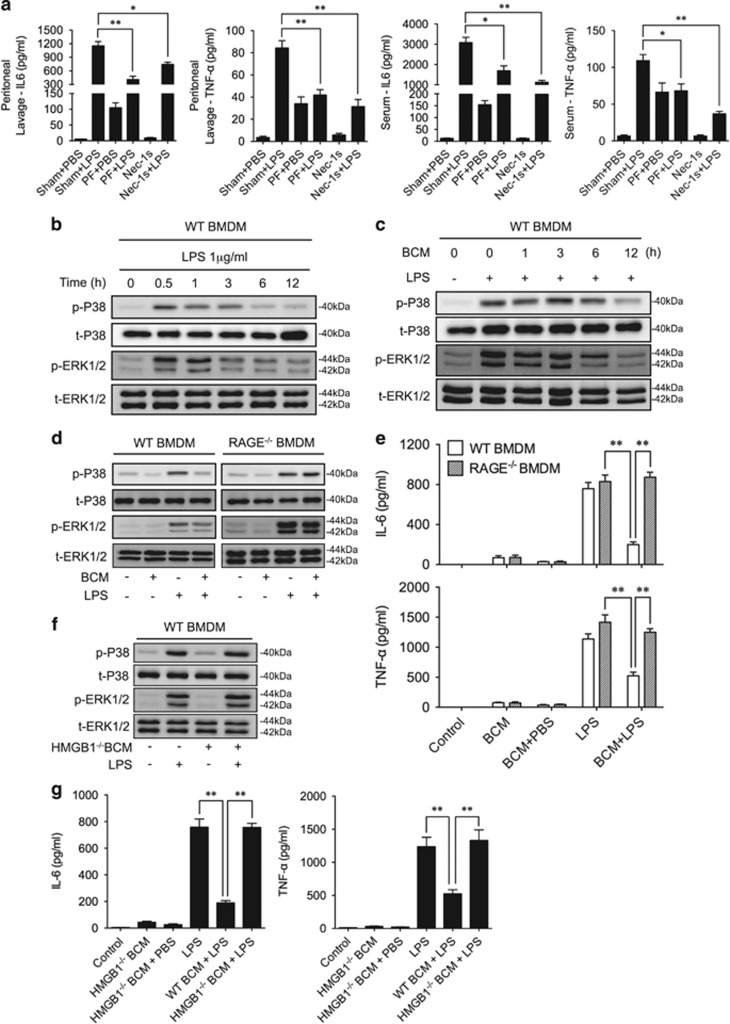
Figure 6.
Tissue damage suppresses LPS-induced inflammation. (a) WT mice were subjected to one of the following six groups: (1) Sham for 12 h followed by PBS (vehicle, 0.2 ml i.p.) (Sham+PBS); (2) Sham for 12 h followed by LPS (2 mg/kg BW in 0.2 ml of PBS i.p.) for 6 h (Sham+LPS); (3) Pseudo-fracture (PF) for 12 h followed by PBS (0.2 ml i.p.) (PF+PBS); (4) PF for 12 h followed by LPS (2 mg/kg BW i.p. in 0.2 ml of PBS for 6 h) (PF+LPS); (5) Nec-1 s (30 mmol/kg BW i.p. in 0.2 ml of PBS) for 6 h (Nec-1 s); and (6) Nec-1 s (30 mmol/kg BW i.p.) and LPS (2 mg/kg BW i.p. in 0.2 ml of PBS) for 6 h (Nec-1 s+LPS). The peritoneal lavage fluid and serum were then collected for measurement of IL-6 and TNF-α by ELISA. (b) WT BMDM were treated with LPS (1 μg/ml) for 0–12 h, and the phosphorylation of P38 and ERK1/2 MAPK were then detected by western blot. (c) WT BMDM were pretreated with BCM (40 μl/ml) for 0–12 h, and then were washed for three times followed by treatment with LPS (1 μg/ml) 0.5 h. Phosphorylation of P38 and ERK1/2 MAPK were detected by western blot. (d) WT or RAGE−/− BMDM were pretreated with BCM (40 μl/ml) for 12 h, and then were washed for three times followed by the treatment with LPS (1 μg/ml) for 0.5 h. Phosphorylation of P38 and ERK1/2 MAPK were detected by western blot. (e) WT and RAGE−/− BMDM were pretreated with BCM (40 μl/ml) for 12 h, and then were washed for three times followed by the treatment with LPS (1 μg/ml) for 6 h. IL-6 and TNF-α concentration in the supernatant were then measured by ELISA. (f) WT BMDM were pretreated with WT or HMGB1-lacking BCM (40 μl/ml) for 12 h, and then were washed for three times followed by the treatment with LPS (1 μg/ml) for 0.5 h. Phosphorylation of P38 and ERK1/2 MAPK were then detected western blot. (g) WT BMDM were pretreated with WT or HMGB1-lacking BCM (40 μl/ml) for 12 h, and then were washed for three times followed by the treatment with LPS (1 μg/ml) for 6 h. IL-6 and TNF-α in the supernatant were measured by ELISA. All results are representative of three independent experiments. The graphs show the mean and S.E.M., n=3. *P<0.05 and **P<0.01 compares between the indicated groups

