Figure 6.
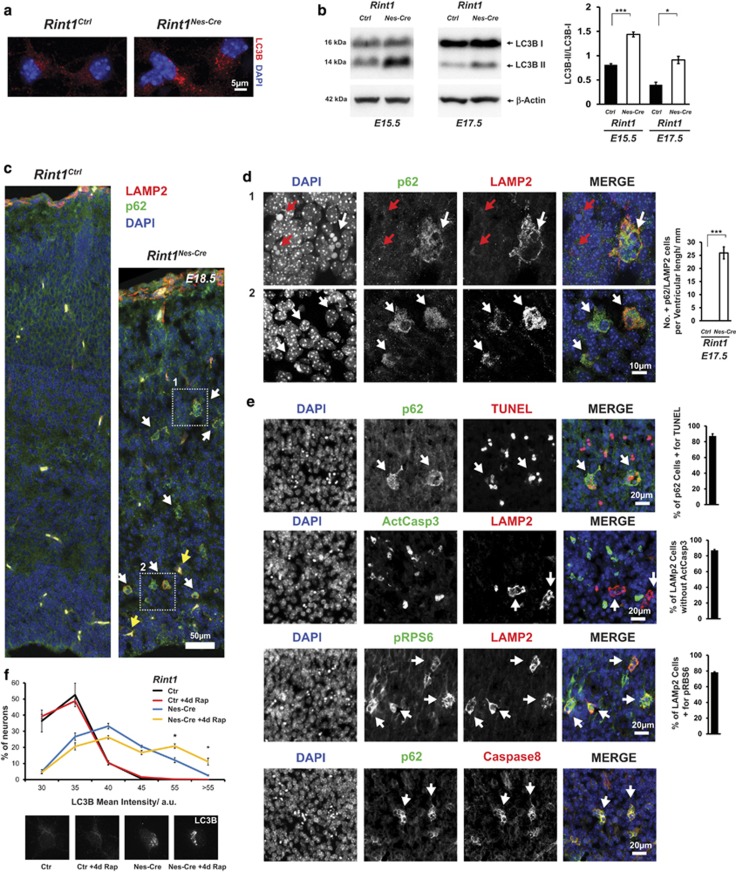
Defective autophagy after Rint1 inactivation. (a) Accumulation of autophagosomes labeled by LC3B in cortical neurons. (b) Western blot analysis of protein extracts from cortex shows increased conversion from LC3B-I to LC3B-II. Right panel shows quantification of LC3B-II/LC3B-I ratio from three different embryos. (c) Confocal microscopy of p62- (green) and LAMP2- (red) positive neurons marked by white arrows in Rint1Nes-Cre cortex from E18.5. Yellow arrows indicate blood cells. Magnified images from frames 1 and 2 in (c) are depicted in (d). All p62- and LAMP2-positive cells in CP are with pyknotic nuclei (white arrow) representing dying cells (d1), however, not all cells with pyknotic nuclei show accumulation of p62 and LAMP2 (red arrows). In lower panel, confocal microscopy shows that in SVZ p62/LAMP2-positive neurons does not exhibit pyknotic nuclei (white arrows). Right panel shows quantification of p62- and LAMP2-positive cells in Rint1Nes-Cre cortices. p62- and LAMP2-positive cells (white arrows) co-localize with TUNEL, p-RPS6, Caspase8 but not with active Caspase3 (e) at E17.5. Right panel shows percentage for co-localization of indicated signals. (f) Percentage of neurons with given mean intensity of LC3B signals from Rint1Ctrl and Rint1Nes-Cre cortices after 4 days treatment with 100 nM rapamycin. Stars indicate significance in two tailed Student's t-test *P<0.05, ***P<0.0005

