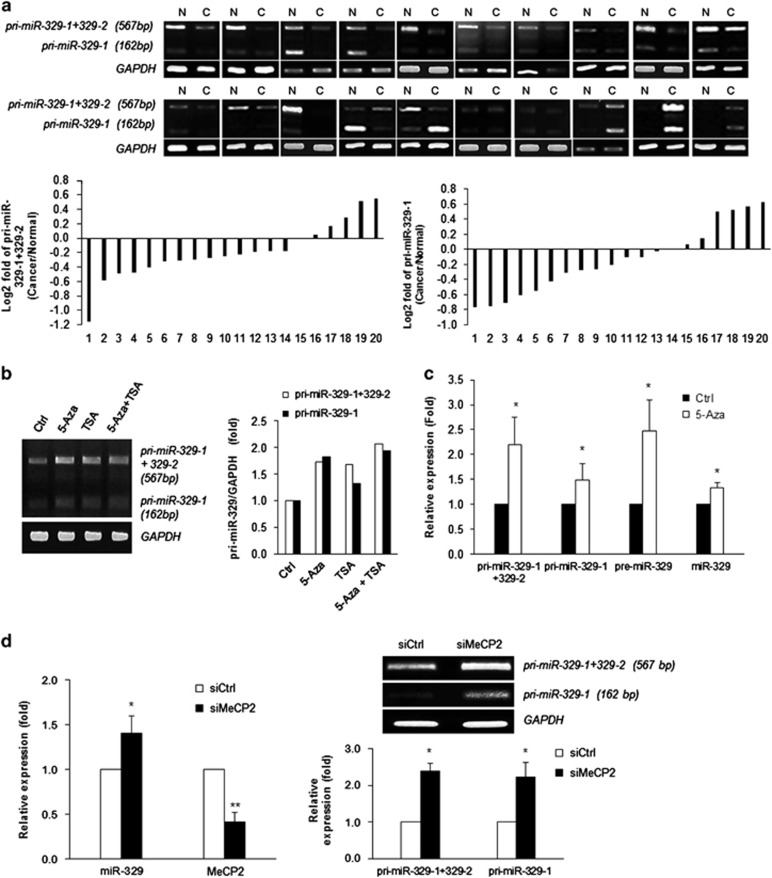
Figure 6.
Expression of miR-329 is regulated by MeCP2. (a) Relative expression levels of primary transcript (pri-miR-329) in a subset of breast specimens. Total RNA was isolated from breast cancer samples or the corresponding normal tissues, and relative expression levels of pri-miR-329 were assessed using conventional RT-PCR. Pri-miR-329 (pri-miR-329-1 (162 bp) and pri-miR-329-1+pri-miR-329-2 (567 bp)) was detected as two conspicuous bands using the primer sets shown in Table 1. The log2 value shows pri-miR-329 relative fold change in 20 paired human breast specimens. (b) Relative expression level of pri-miR-329 after 5-aza-2′-deoxycytidine (5-Aza) and/or Trichostatin A (TSA) treatment were determined by RT-PCR. (c) Relative expression levels of pri-miR-329, pre-miR-329, and mature miR-329 after 5-Aza treatment were determined by RT-qPCR or RT-PCR. GAPDH mRNA or U6 snRNA were used for normalization of pri-/pre-miR and mature miR, respectively. (d) Relative expression levels of miR-329 after MeCP2 silencing. Forty-eight hours after transfection of MeCP2 siRNA or control siRNA into MCF7 cells, pri-miR-329 level was analyzed by RT-PCR. The data are presented as mean±S.D. of three independent experiments (paired t-test); *P<0.05

