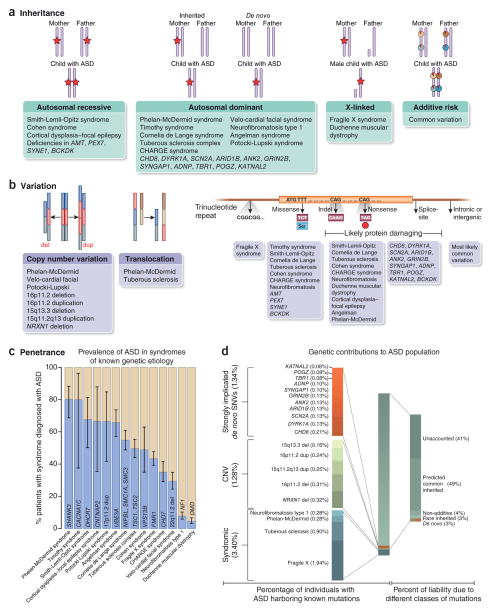
Figure 1.
Genetic architecture of autism spectrum disorders. (a) The inheritance patterns of syndromes with known genetic etiology and high incidence of autism, as well as that of genes recently identified to be associated with autism. The red stars indicate a causal allele and the red pie charts indicate a small proportion of risk. Most dominant disorders show de novo inheritance. Autosomal recessive, autosomal dominant and X-linked inheritance patterns best fit a major gene model, whereas a polygenic model is best represented by additive risk. (b) The types of genetic variation (left and middle) and the developmental disorders (right) associated with autism. Genes that have been associated with ASD are also indicated. (c) The penetrance of known syndromic mutations summarized from multiple studies. 95% binomial proportion confidence intervals, based on Wilson’s score interval, are shown. (d) The percentage of individuals with ASD harboring known mutations, as well as the percentage of liability from different classes of mutations (taken from ref. 57). The percentage variance in liability measures the contribution of a particular variant or class of variants relative to the population variance in a theoretical variable called liability. Liability is a continuous and normally distributed latent variable that represents each individual’s risk (both genetic and environmental) for developing a disease266. Notably, percentage variance in liability is directly dependent on the frequency of the variant and the effect size of the variant, and it is inversely dependent on the frequency of the disease in the population. References for this figure are found in Supplementary Table 1.

