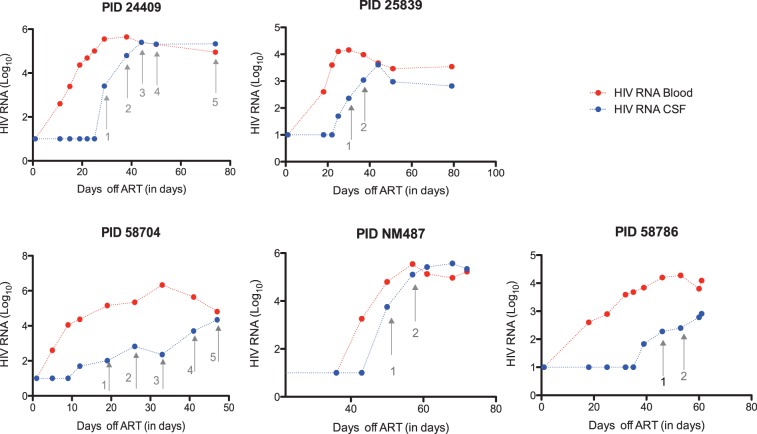
Figure 1.
Dynamics of HIV RNA rebound in CSF supernatant (blue) and blood plasma (red) for five participants belonging to group 1 (prospective cohort). Each dot represents a study visit with blood and CSF collection. Time points used for sequence analysis are indicated with arrows. X axis shows time after interruption of ART (in days), Y axis shows HIV RNA viral load (log10).

