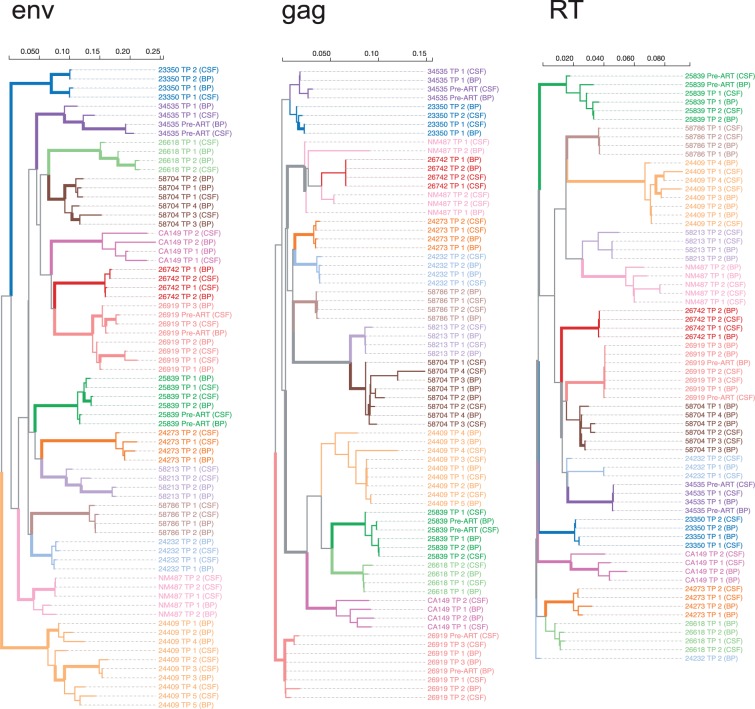
Figure 3.
Approximate maximum-likelihood trees for each sequenced genomic region, based on the consensus sequences for every time point and source compartments. The trees are (arbitrarily) rooted on the reference (HXB2) sequence [not shown], and color-coded by individual. Interior branches are assigned a (non-gray) color if all of their descendants have the same color, i.e. they are assumed to represent evolution within the corresponding host, and are drawn as thick lines if they have 0.9 or greater aLRT support. Branch lengths are scaled in expected substitutions per nucleotide site.

