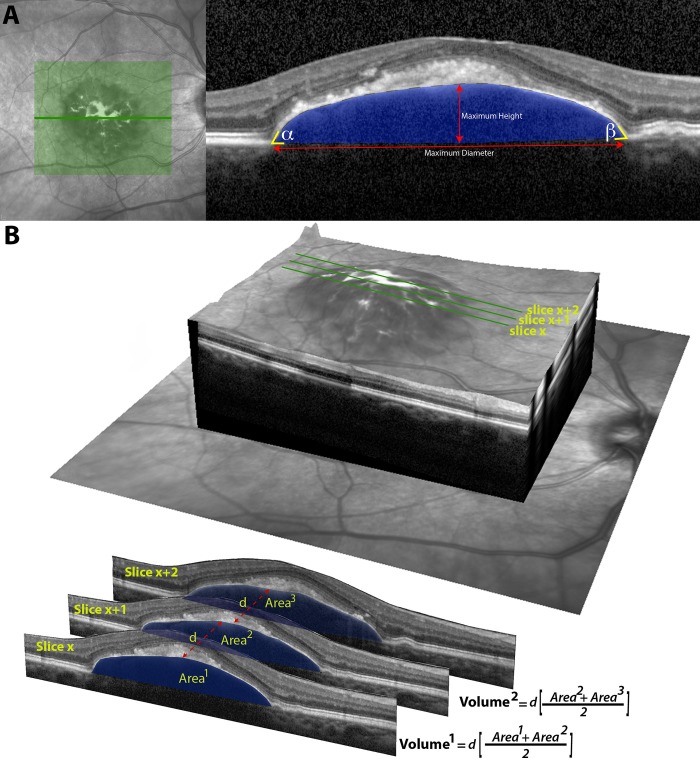
Figure 2.
Quantifying morphometric and volumetric characteristics of drusenoid PEDs. A single SD-OCT B-scan (A) is used to illustrate the measurements that were acquired from the PED, which included maximum height and diameter. The angle of intersection between the RPE+BL band and BrM in the temporal (α) and nasal (β) margins of the PED was also determined. Manual tracing of Bruch's membrane and the outer margins of the RPE+BL band was used to calculate the cross-sectional area (blue shade) of the drusenoid PED. Area measurements from each slice in the OCT volume scan were then used to perform volumetric calculations (B). Three contiguous OCT slices illustrate the application of the Cavalieri principle in stereology for calculating volume. The volume of a segment, defined as the volume between two contiguous OCT slices, was determined by averaging the area of the drusenoid PED in the two slices and multiplying it by the distance (d) separating the slices. Summation of volumetric measurements from each segment allowed calculation of the entire volume of the PED.

