
Figure 3.
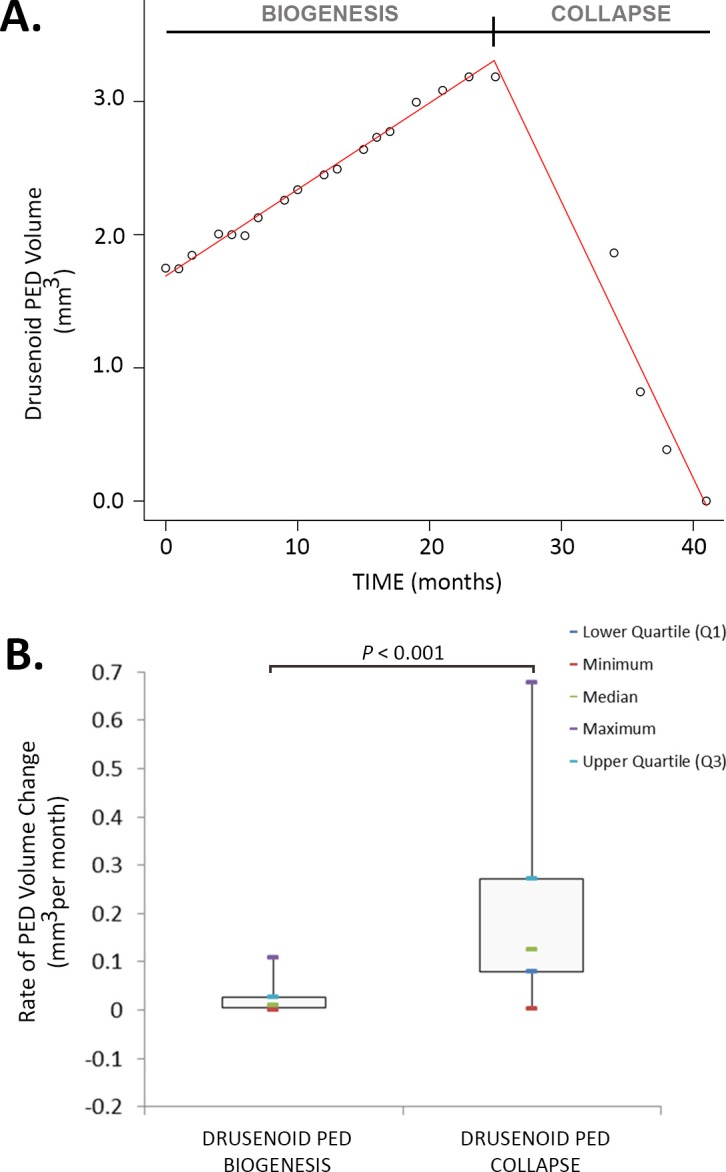
Drusenoid PED lifecycle. An illustrative plot of PED volume as a function of time is provided from a 72-year-old patient that was monitored over a period of 41 months (A). Lines of best fit, as determined by piece-wise linear regression analysis, are shown in red. Note the significant break point at 23 months where the gradient of the slope changes from positive to negative. Comparisons of the rate of drusenoid PED biogenesis (formation) and collapse in the cohort demonstrates a significant difference (B). The absolute value of the gradient of the slope for PED collapse is significantly greater than PED biogenesis. Box and whisker plots are used to summarize the rates of PED formation and collapse.