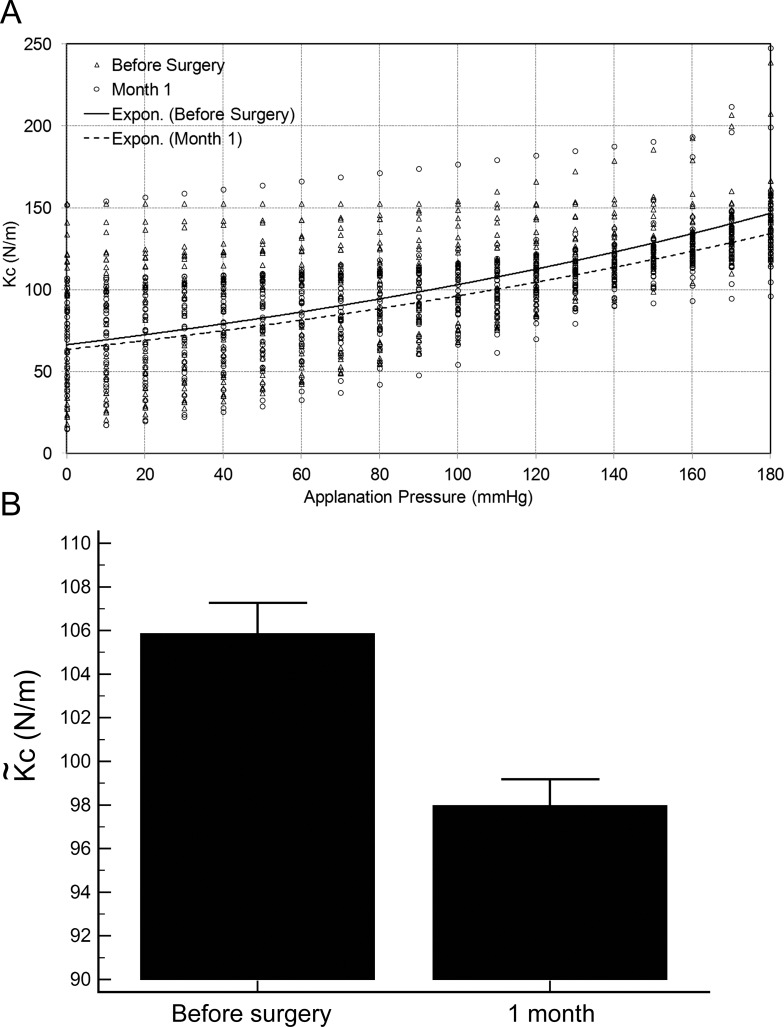
Figure 5.
Corneal stiffness versus applanation pressure before and after surgery in all the treated eyes is shown in the top figure. The continuous lines are regressions of the preoperative (solid line) and postoperative (dotted line) data (top figure). The bottom figure shows the mean corneal stiffness before and 1 month after surgery. * Indicates statistically significant difference (P = 0.001) before and after surgery in mean corneal stiffness.

