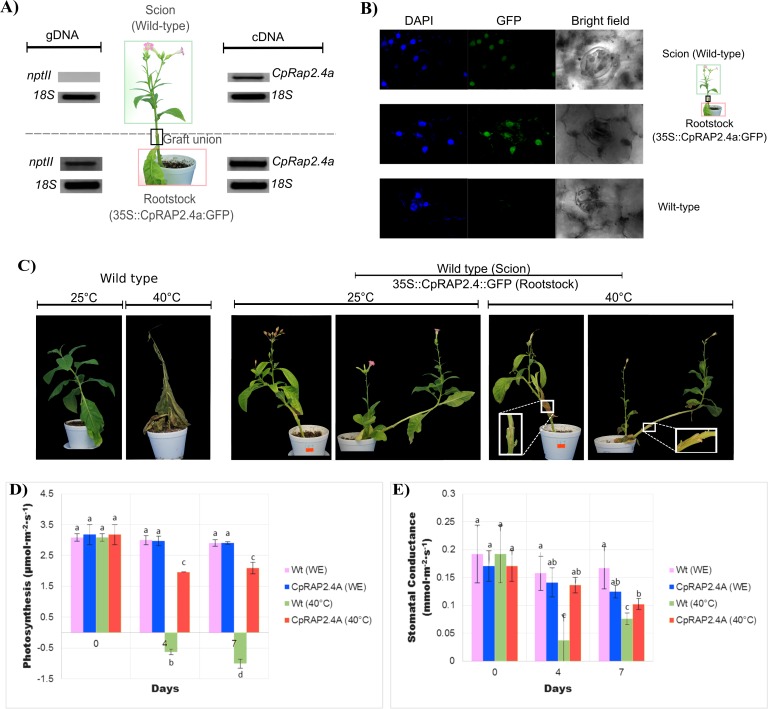
Fig 6. Long-distance transport assays of CpRap2.4a by tobacco grafting.
A) Genomic DNA (left section) was isolated from wild-type (upper section; Scion) or transgenic plants (below section; Rootstock) for amplification using PCR. The nptII primers were used to identify the neomycin phosphotransferase II (nptII) that is the selection marker of plants contained in the T-DNA. Total RNA (right section) was isolated from the wild-type tobacco (upper section; Scion) or from the transgenic tobacco plant (below section; Rootstock) for amplification using RT-PCR. CpRap2.4a primers were used to identify the accumulation of the CpRap2.4 transcript. Quantification values of nptII or the CpRap2.4a gene were normalized with the 18S gene. B) Subcellular accumulation patterns of CpRAP2.4a proteins fused to GFP in a tobacco plant graft. Leaf sections of a wild-type tobacco (horizontal first line) were taken under different light sources (DAPI staining is observed in the first vertical line, GFP is observed in the second vertical line and transmitted light is observed in the third vertical line). DAPI staining or GFP fluorescence in the leaf is shown for transformed tobacco plants (second horizontal line) that carry the CpRap2.4a gene in their genome. The fluorescence of the GFP and DAPI staining was taken at 40X by an Olympus FV1000 confocal microscope. Wild-type tobacco plants were used as the control (third horizontal line). C) Phenotypes of the tobacco plant grafts with the CpRap2.4a gene under high temperature stress (40°C) or at room temperature (25°C). Wild-type tobacco plants were used as a control. D) and E) Physiological effects of CpRap2.4a rootstock overexpressing tobacco plants under high temperature treatments in the photosynthetic activity and stomatal conductance from leaves of the wild type tobacco plants. N. tabacum transgenic (Rootstock) and wild type tobacco (Scion) plants were treated at 40°C during different times. Data was analyzed by one-way analysis of variance (ANOVA) followed by the comparison of mean values using the Tukey's test at P<0.01. Data were presented as mean ±SD error of at least three independent determinations per sample. Different letters indicate significant differences. Units: [photosynthesis = μmol.CO2.m-2.s-1; Stomatal conductance = mmol.m-2.s-1].

