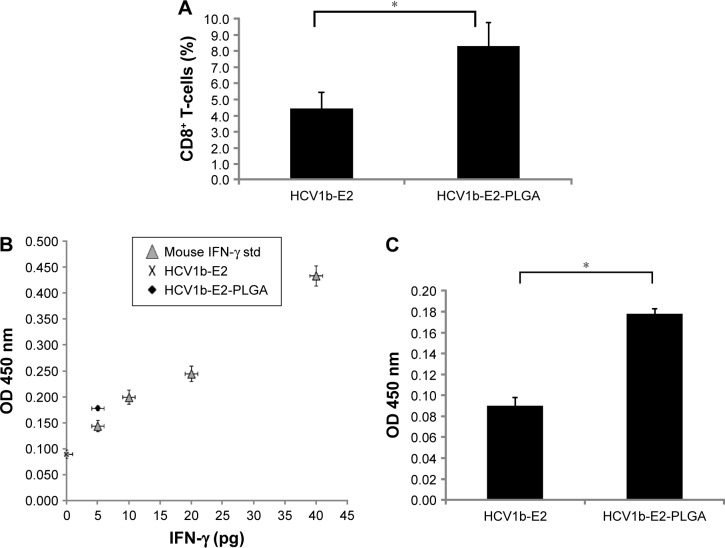
Figure 7.
HCV1b-E2-immunized mice and HCV1b-E2-PLGA-immunized mice were monitored for CD8+ T-cells.
Notes: Percentage of CD8+ T-cells with FITC staining is shown in (A). Bars correspond to the arithmetic mean value (n =3) ± SD. *P<0.05 between HCV1b-E2 and HCV1b-E2-PLGA (A). IFN-γ levels (pg) in culture supernatant of mice lymphocytes immunized with HCV1b-E2 and HCV1b-E2-PLGA for 72 hours. The average level of IFN-γ in each group is shown in (B). Bars represent the arithmetic average (n =3) ± SD. *P<0.05 between HCV1b-E2-PLGA and HCV1b-E2 (C).
Abbreviations: PLGA, poly d,l-lactic-co-glycolide; FITC, fluorescein isothiocyanate; SD, standard deviation; OD, optical density.

