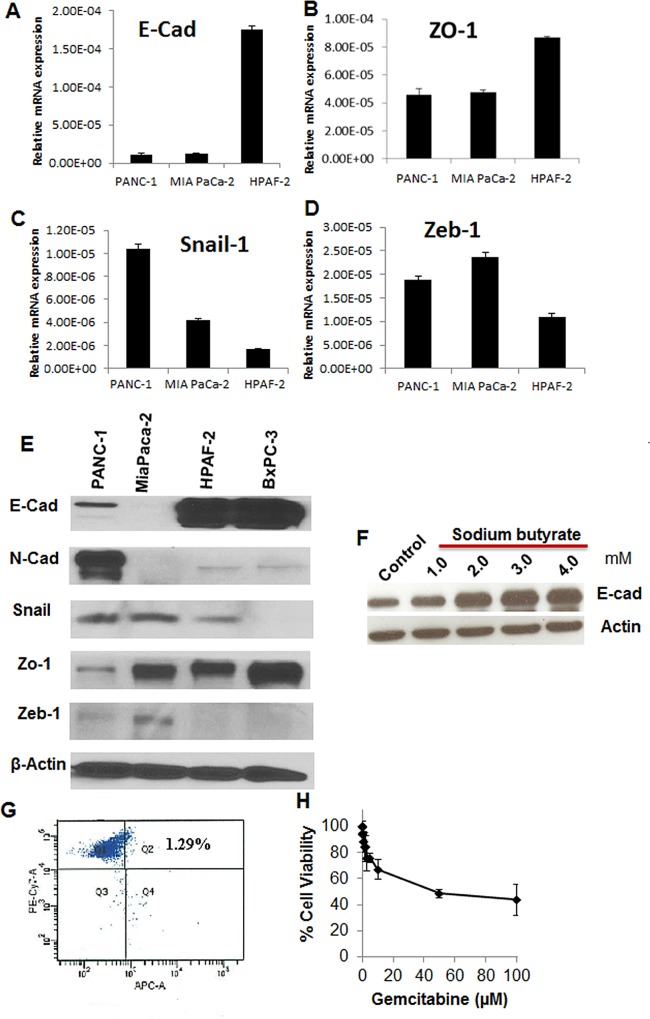
Fig 1. Baseline features of PANC-1, MIA PaCa2, and HPAF-2 pancreatic cancer cells in EMT related gene expression, CSC population, and resistance to gemcitabine.
A-D. mRNA levels of E-cadherin (E-Cad), Zo-1, Zeb-1 and Snail-1. RT-PCR data was normalized to 18s rRNA and represented as mean ± SD of 2-ΔCt of triplicate determinations of 3 individual experiments. E. Western blots for E-cadherin and N-cadherin expression in 4 pancreatic cancer cell lines. Actin was a loading control. F. Western blots for E-cadherin expression in PANC-1 cells treated with sodium butyrate. G. Flow cytometry identification of CSCs in PANC-1 cells. CD24+/CD44+/EpCAM+ subpopulation were detected as pancreatic cancer CSCs. PANC-1 cells were triple stained with PE-conjugated anti-CD24, PE-Cy7-conjugated anti-CD44 and APC-conjugated anti-EpCAM. DAPI staining was used for identification of living cells. Cells were analyzed with multi-label flow cytometry. The upper-right quadrant showed CD44+/ EpCAM + cells within CD24+ gated population. H. Resistance of PANC-1 cells to gemcitabine treatment. PANC-1 cells viability was determined at 72 hrs of incubation using MTT assays. Data represent Mean ± SD of triplicate measurements of 4 individual experiments. Gemcitabine concentrations up to 5 mM were used but failed to achieve 90% cell death.

