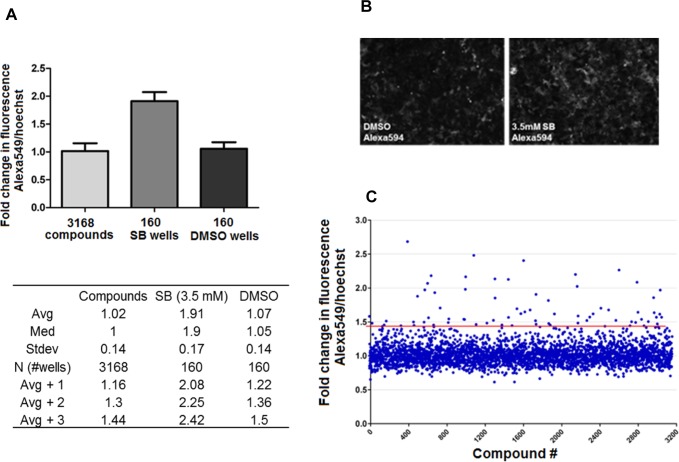
Fig 2. Validation of the immunofluorescent HTS assay.
A. Average signal and standard deviation of the positive and negative controls, compared to the average of all screened compounds. Total 3,168 compounds were from Microsource (2,320 compounds) and Prestwick (848 compounds) compound libraries. Every plate included 16 wells of vehicle (0.35% DMSO) treated cells, and 16 wells of cells treated with 3.5 mM sodium butyrate (SB). Avg +1, +2 and +3 represent signals 1, 2 or 3 standard deviations above average. B. Representative images of E-cadherin immunofluorescence of PANC-1 cells treated by 0.35% DMSO, or 3.5 mM sodium butyrate (SB). E-cadherin was detected by anti-E-cad primary antibody (1:250 dilution) followed by Alexa594 conjugated secondary antibody (1:500 dilution). C. The relative fluorescence (ratio of AlexaFluor to Hoechst, fold over DMSO vehicle) was plotted against individual wells to visualize the data spread. The median for control wells (DMSO vehicle) was 1-fold, with a 0.1-fold standard deviation. The HCS assay cutoff was 3 standard deviations above the median (1.437-fold), marked by the red line. Eighty four compounds had readings greater than or equal to this cutoff.

