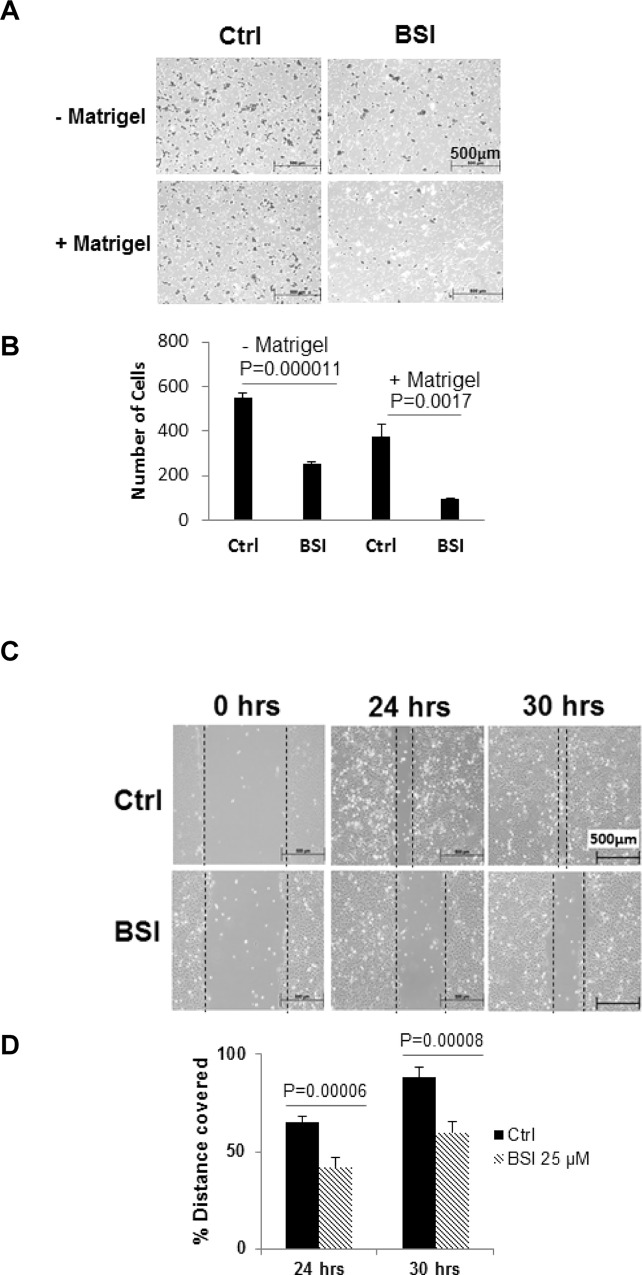
Fig 7. Inhibition in cell invasion and migration of pancreatic cancer cells by BSI.
A, B. Matrigel invasion assays for PANC-1 cell migration and invasion. Cells were exposed to 25 μM BSI. Cell migration (without Matrigel) and invasion (with Matrigel) were detected at 24hrs. Bar graph (B) shows the average number of migrated/invaded cells per field (Mean ± SD of at least 5 fields per experiment for 3 repeated experiments). C, D. Scratch assay for BxPC-3 pancreatic cancer cell migration. Scratch was made on confluent monolayer and then exposed to 25 μM BSI. Cell migration was measured at 24 and 30 hrs post BSI treatment. Bar graph (D) shows the % distance covered by BxPC-3 cells. Data represents Mean ± SD of 3 repeats.

