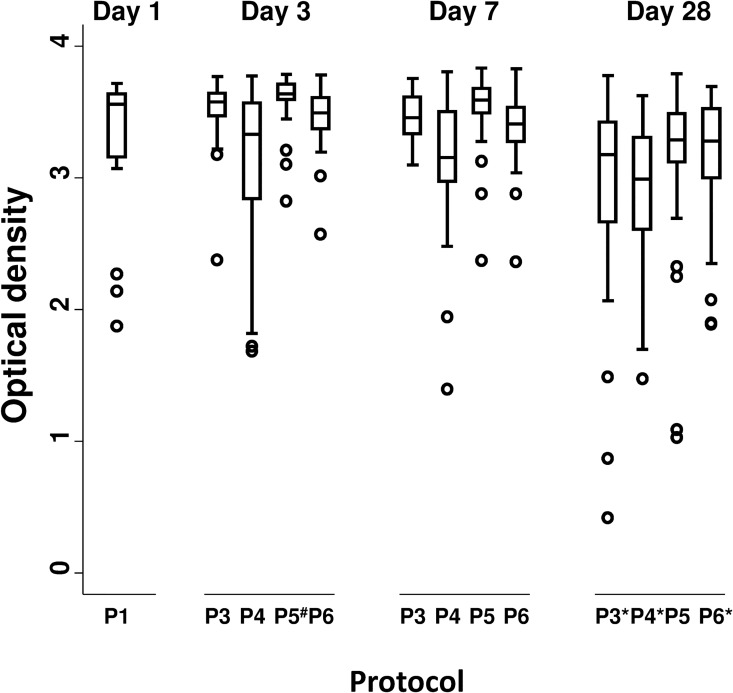
Fig 3. Boxplots of the optical density values obtained with the Erns-based Ag ELISA for different protocols at day 1 (reference), 3, 7 and 28.
Legend: P1, P3, P4, P5 and P6: protocols applied to the samples. P1 at day 1 is the reference protocol. # Optical density (protocol P5 at day 3) is significantly higher than the reference protocol. * Optical density (protocols P3, P4 and P6 at day 28) is significantly lower than the reference protocol.

